
A Long-Term Polydromic Function to Disentangle Personal Remittance, Migration and Employment in Agriculture in Order to Raise the GDP of the Donor aid Ratio in Five African Countries
Abstract
Economic statistics concerning the quinquennial features of Agriculture employment (A), net Migration (M), Donor aid (D) and Personal remittances (P), available for over forty years from five West African countries have here been related to the GDP (G). The overall results of a multilinear regression (R2 0.84) have confirmed that the GD ratio, which is an index of aid efficiency, is significantly and positively driven by the PD ratio (high P and low D - favorable) and the PA ratio (high P and low A - favorable), but negatively driven by the PG ratio ( a higher D efficiency is obtained for constant G and lower P). A higher migration flux corresponds to a non-significant rise in the GD ratio. The five countries are clustered, by means of a principal component analysis, into three types. Partial least square regressions fitted to the GD ratio within each cluster provide a long-term polydromic function that highlights certain particular cluster features: reactive to forcing factors, such as Donor diminutions (SEN), active, as driven by Personal remittance (MLI), and mostly entropic for GMB, GNB and MRT. The learnt from the database is that Donor variations may follow different evolutions of the GD ratio in the three clusters.
Author Contributions
Academic Editor: Abubaker Haroun Mohamed Adam, Department of Crop Science (Agronomy), College of Agriculture, Bahri University- Alkadaru- Khartoum -Sudan.
Checked for plagiarism: Yes
Review by: Single-blind
Copyright © 2021 Ebrima K. Ceesay, et al.
 This is an open-access article distributed under the terms of the Creative Commons Attribution License, which permits unrestricted use, distribution, and reproduction in any medium, provided the original author and source are credited.
Competing interests
The authors have declared that no competing interests exist.
Citation:
Introduction
Agriculture and employment in agriculture remain a vital source of livelihood for the majority of African countries, as can be observed in Senegal (SEN), Mali (MLI), Gambia (GMB), Guinea Bissau (GNB), and Mauritania (MRT), the five countries on which the study is based. West African agriculture is mainly characterized by subsistence farming, which leads to a dependence on rain-fed agriculture, a low use of irrigation methods, limited public investment in agriculture, gender disparities between males and females, institutional support and a lack of credit facilities to support small and medium sized farmers. All these factors prevent these countries from increasing their agriculture productivity, mitigating and adapting to climate change problems and encouraging agricultural value chains and trade liberalization. According to ILO 1, the agricultural employment sector on average constitutes 54% of the working population in Africa. In addition to the massive labor force, sub-Saharan Africa also has the highest area of uncultivated arable land in the world and a huge agricultural growth potential 2,3. However, African countries have not yet taken advantage of this potential. Despite the importance of the sector, about one-fourth of the population experiences hunger in sub-Saharan Africa. Out of about 795 million people who globally suffer from chronic under nourishment, 220 million live in sub-Saharan Africa. The FAO 4 states that this figure, which is at around 23.2%, indicates the highest prevalence of undernourishment throughout the world. However, food shortages can also happen in food abundant regions, mostly due to poor conservation techniques or post-harvest losses. In fact, overall, the continent is a net importer of food, which puts additional strain on the scarce foreign exchange reserves.
The women involved in agriculture in particular face severe challenges. Although they represent 47% of the labor force, they are prominently smallholder farmers, because the patriarchy system has tended to discriminate against them 2. The customary laws and rules that govern the ownership and transfer of land rights are generally unfavorable to women in sub-Saharan Africa, and titles and inheritance rights are conferred to male family members. The women involved in agriculture also suffer from a lack of access to finance, to modern inputs as well as to a lack of knowledge and skills about modern agricultural practices 3. Without these disadvantages, women could be just as industrious as men, not only in agriculture but also in each and every sector. According to the FAO 5, if women had access to the same resources as men, their agricultural yields would increase by up to 30%, thereby reducing the number of hungry people globally by 100–150 million.
Migration and remittances are interconnected 6. Migration has been projected to boost Africa’s GDP per capita from $2,008 in 2016 to $3,249 in 2030, that is, growing at an annual rate of 3.5% from 2016 7.
The knowledge and statistics about Donor Aid in the ECOWAS region were reviewed and discussed by Engel and Jouanjean 8, with the aim of providing an overview to help inform programs, as well as to encourage more sector- and country-focused studies.
The covariance among migration, employment in agriculture and remittance received from outside, as a component of the GDP, enables the efficiency of foreign aid in West African countries to be disentangled. The present paper explores the roles played by each endogenous variable in the contribution to the GDP of these countries. The study highlights the key features in which the migration of labor from agriculture, remittances received by skilled or unskilled immigrants, and the employment of the young in agricultural industries can contribute toward the economic growth and potential of such countries to achieve sustainable development goals (SDGS).
Experimental Procedure
The aims of the study in particular have been: 1) to build a multilinear regression model (MLR) of the economic statistics available for over forty years from five West African countries by maximizing the Donor aid (D) to GDP (G) (DG) ratio using the ratios of Personal remittances (P) to G (PG), of P to D (PD), and of P to Agriculture employment (A) (PA) as independent variables, and including the net Migration flux (M) in the model; 2) to cluster the five countries, through a principal component analysis (PCA), and to establish a set of partial least square regression models (PLSR) of the five countries, in order to describe a long-term polydromic function that can be used to disentangle Personal remittances, Agriculture employment and migration, to raise the Donor aid-to-GDP ratio.
Material and Methods
Source of Data
The data used in this study (Table 1) were obtained from quinquennial WDI statistics for the 1977-2017 interval from the five aforementioned countries in West Africa (Figure 1). When data were missing, the entire rows were eliminated, and for this reason there is a total observation number of 32 (Table 2).
Figure 1.The study area: Gambia (GMB, 10 380 km2), Guinea-Bissau (GNB, 36125 km2), Mali (MLI, 1 240 192 km2), Mauritania (MRT, 1 030 700 km2) and Senegal ( SEN, 196 723 km2).
Statistical Analyses
A partial least square regression (PLSR) method is recommended when the number of observations is limited compared to the dependent \ independent variables. This method is used widely in spectroscopy to fit quantitative dimensions 9, discriminate qualitative classes 10, or to solve economic problems 11, 12. A different approach, with latent variables, which is usually applied in the socio-economic field, is the PLS path method 13. In the present paper, a multilinear regression (MLR), a PLSR and a principal component analysis (PCA) have been used, as taken from the XLSTAT 2019.4.1 (Addinsoft SARL USA, New York, NY, USA) package. The PLSR models were fitted to the GD ratio for the five countries, using all of the four main independent variables (P, D, A, M) as well as their relative ratios to P (PG, PD, PA). A single MLR model was fitted to the overall countries, with GD as a dependent variable and PG, PD, PA, and M as independent ones. The PCA was applied to the whole dataset to find clusters among the countries.
Results
Dataset (Table 2). The data used in the work are presented in Table 2.
MLR solution for the overall country DG. A good fit was achieved for all the relationships across the years (Table 3) with an R2 of 0.84 (Figure 2). The DG ratio was favored by a positive PD ratio, with a higher Std. Coef. (+1.87) and R2 (0.699) as well as by an increase in the (negative) migration fluxes (-0.13; P 0.06). Moreover, the DG ratio was significantly and inversely related to the PG ratio (-0.88) and to the PA ratio (-0.35).
Table 1. Variables retrieved from the WDI database| Variables | Comments |
| G- GDP Current (US$) | Current GDP |
| M- Net Migration | Net migration is the number of immigrants minus the number of emigrants, including citizens and noncitizens, for the five-year period. |
| P- Personal Remittances | Personal remittances, received (current US$) |
| A- Employment in agriculture (% of total employment) | Employment in agriculture (% of total employment) (modeled ILO estimate) |
| D- Net bilateral aid flows | Net bilateral aid flows from DAC donors, Total (current US$) |
| Country | Year | G_M$ | M_K | A_% | D_M$ | P_M$ | G/D | P/D_% | Ln(P/A) | PG% |
| G | M | A | D | P | GD | PD | PA | PG | ||
| GMB | 1982 | 216.05 | 14.88 | 42.13 | 30.31 | 0.19 | 7.13 | 1% | 8.40 | 0.09% |
| GMB | 2007 | 1279.70 | -15.44 | 32.92 | 42.44 | 55.66 | 30.15 | 131% | 14.34 | 4.35% |
| GMB | 2012 | 1415.01 | -15.44 | 30.54 | 50.85 | 106.35 | 27.83 | 209% | 15.06 | 7.52% |
| GMB | 2017 | 1504.95 | -15.44 | 28.48 | 94.89 | 228.18 | 15.86 | 240% | 15.90 | 15.16% |
| GNB | 1992 | 226.31 | -30.00 | 73.16 | 64.39 | 1.33 | 3.51 | 2% | 9.81 | 0.59% |
| GNB | 1997 | 268.55 | -41.17 | 72.96 | 84.41 | 2.00 | 3.18 | 2% | 10.22 | 0.74% |
| GNB | 2002 | 415.84 | -27.93 | 72.51 | 48.1 | 17.63 | 8.65 | 37% | 12.40 | 4.24% |
| GNB | 2007 | 695.99 | -17.50 | 71.77 | 88.59 | 43.03 | 7.86 | 49% | 13.30 | 6.18% |
| GNB | 2012 | 989.33 | -7.01 | 70.53 | 51.92 | 45.64 | 19.05 | 88% | 13.38 | 4.61% |
| GNB | 2017 | 1346.84 | -7.00 | 68.85 | 52.54 | 104.92 | 25.63 | 200% | 14.24 | 7.79% |
| MLI | 1977 | 1049.84 | -175.00 | 81.53 | 72.82 | 26.50 | 14.42 | 36% | 12.69 | 2.52% |
| MLI | 1982 | 1333.75 | -218.06 | 79.44 | 115.05 | 39.41 | 11.59 | 34% | 13.11 | 2.95% |
| MLI | 1987 | 2090.63 | -493.98 | 77.35 | 255.31 | 88.18 | 8.19 | 35% | 13.95 | 4.22% |
| MLI | 1992 | 2830.67 | -173.49 | 74.02 | 310.3 | 116.55 | 9.12 | 38% | 14.27 | 4.12% |
| MLI | 1997 | 2697.11 | -141.95 | 73.31 | 308.09 | 91.72 | 8.75 | 30% | 14.04 | 3.40% |
| MLI | 2002 | 3889.76 | -67.11 | 71.54 | 308.59 | 137.65 | 12.60 | 45% | 14.47 | 3.54% |
| MLI | 2007 | 8145.69 | -100.82 | 69.78 | 736.61 | 343.92 | 11.06 | 47% | 15.41 | 4.22% |
| MLI | 2012 | 12442.75 | -302.45 | 68.06 | 818.1 | 827.46 | 15.21 | 101% | 16.31 | 6.65% |
| MLI | 2017 | 15337.74 | -200.00 | 63.01 | 928.83 | 883.26 | 16.51 | 95% | 16.46 | 5.76% |
| MRT | 1977 | 540.64 | -9.70 | 71.42 | 36.07 | 0.31 | 14.99 | 1% | 8.37 | 0.06% |
| MRT | 1982 | 750.21 | -16.10 | 69.17 | 75.65 | 2.32 | 9.92 | 3% | 10.42 | 0.31% |
| MRT | 1987 | 909.82 | -40.00 | 66.91 | 107.66 | 6.70 | 8.45 | 6% | 11.51 | 0.74% |
| MRT | 1992 | 1464.39 | -44.62 | 63.10 | 159.4 | 50.13 | 9.19 | 31% | 13.59 | 3.42% |
| MRT | 1997 | 1401.95 | -44.00 | 62.57 | 177.75 | 2.69 | 7.89 | 2% | 10.67 | 0.19% |
| SEN | 1982 | 3936.76 | -85.11 | 58.10 | 228.62 | 66.31 | 17.22 | 29% | 13.95 | 1.68% |
| SEN | 1987 | 6381.39 | -60.29 | 54.47 | 432.65 | 117.82 | 14.75 | 27% | 14.59 | 1.85% |
| SEN | 1992 | 7602.01 | -77.00 | 48.72 | 494.09 | 175.68 | 15.39 | 36% | 15.10 | 2.31% |
| SEN | 1997 | 5915.25 | -227.55 | 47.80 | 337.26 | 150.47 | 17.54 | 45% | 14.96 | 2.54% |
| SEN | 2002 | 6752.51 | -202.49 | 45.14 | 297.83 | 346.12 | 22.67 | 116% | 15.85 | 5.13% |
| SEN | 2007 | 14285.97 | -218.01 | 40.62 | 548.76 | 1193.38 | 26.03 | 217% | 17.20 | 8.35% |
| SEN | 2012 | 17825.42 | -214.00 | 36.40 | 803.82 | 1576.23 | 22.18 | 196% | 17.58 | 8.84% |
| SEN | 2017 | 21081.67 | -100.00 | 31.54 | 591.98 | 2148.91 | 35.61 | 363% | 18.04 | 10.19% |
| Variables | Coef. | SE | Std. Coef. | SE | P | RR2 partial |
| Intercept | -2.1624 | 4.9389 | 0.665 | |||
| PD | 11.4915 | 1.4932 | 1.2893 | 0.1675 | < 0.0001 | 0.699 |
| PG | -191.4112 | 39.5330 | -0.8259 | 0.1706 | < 0.0001 | 0.098 |
| LN(PA) | 1.2271 | 0.4421 | 0.3881 | 0.1398 | 0.010 | 0.042 |
| M | 0.0063 | 0.0066 | 0.0895 | 0.0932 | 0.346 | 0.005 |
| 0.844 |
Figure 2.Scatterplot of the predicted \ observed GD values from the MLR model labeled by country.
Trends in the Countries.
The GD, G to D ratio (Figure 3). On average, a rise of 0.33±0.09 Y-1(R2 0.28; P 0.00083) is observed over the years, but a decline can be observed for the 1977-1997 interval and a negative shift for GMB, which makes its performance worse from 2007, similarly to SEN, whose trend, however, becomes regularized in 2017. The greatest improvement is observed for GNB. On average, a yearly linear regression of +0.33 Y-1 in the GD ratio is reported, with a mean value of 14.94, corresponding to a growth of +2.2% Y-1 in the GD ratio, but not in G. However, it should be pointed out that the trend only becomes favorable in the new millennium.
The PD, P to D ratio (Figure 4). The value of the ratio started to increase from 2000, as it is driven by the performances of SEN, GMB and GNB. The yearly linear regression is 0.052±0.009 Y-1(R20.55; P 0.0001), which results in a mean value of 0.778, corresponding to a growth of +6.6% Y-1. However, it should be pointed out that the trend only becomes favorable in the new millennium.
The PG, P to G ratio (Figure 5). The ratio of P to G generally increases, and this increase begins to accelerate from 2002, albeit more regularly in GMB and SEN than in GNB and MLI.
The PA, P to A ratio (Figure 6). On average, the P-to-A ratio rises almost regularly by 0.13 per year from 1977, except for MRT, albeit with great differences in the starting levels among the countries, where SEN and MLI surpass the others.
The M, Net Migration flux (Figure 7). Dramatic MLI events occurred in 1987 and 2012. A large increase in migration can be observed from SEN from 1992 to 2012, which eventually reduces. The GNB trend is oriented toward reduced fluxes. The GMB, from the previous host country, is therefore marked by a stable share of estimated migrants.
A, Agriculture employment (Figure 8). Somewhat different conditions characterize the GNB and MLI, which show values of over 65% for 2017, for MRT and around 30% for SE and GMB. The A decay is minimum for GNB (-0.167 % Y-1), intermedium for GMB (-0.387 % Y-1), for MLI ( -0.419 % Y-1) and for MRT (-0.467 % Y-1), while it is maximum for SEN (-0.724 % Y-1).
P, Personal remittances (Figure 9, Figure 10). Starting from 2000, theSenegalese people increase their personal remittances and reach a nearly three-fold value forMLI in 2017 and a nearly fifteen-fold value for the other three (Figure 6). As far as the GMB of the minor countries is concerned, a steady increase vs. GNB and MRT can be observed from 2007 (Figure 7).
D- Net bilateral aid flows (Figure 11). GMB and GNB are mostly entropic, and MRT shows a slow flexus: these three countries are clustered in the D-to-G ratio (see below). SEN and MLI show similar trends with the relative maxima in 1992 and 2012 and with the minima in 2000, but show divergent final trends because SEN D is lowered while D is growing in MLI.
Figure 3.Trend of the G to D ratio for the five countries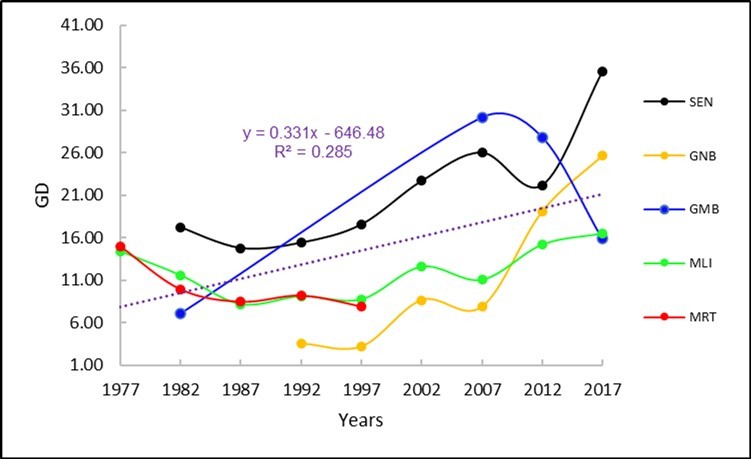
Figure 4.Trend of the P to D ratio for the five countries, with linear and parabolic yearly regressions
Figure 5.Trend of the P to G ratio for the five countries.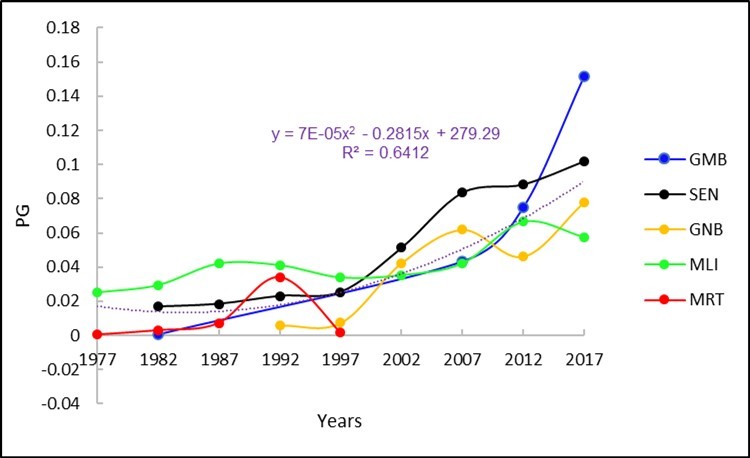
Figure 6.Trend of the Ln (P/Agriculture employments) for the five countries
Figure 7.Trends of the absolute migration flux for the five countries
Figure 8.Trends of agriculture employment for the five countries
Figure 9.Trend of the personal remittance for the five countries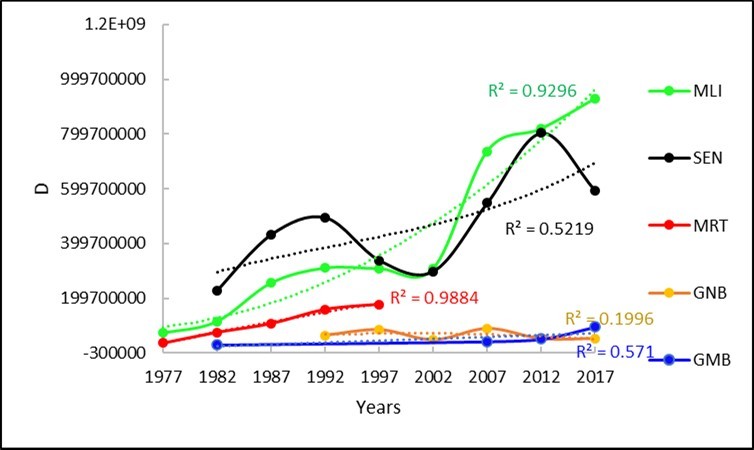
Figure 10.Trend of the personal remittances for the three minor countries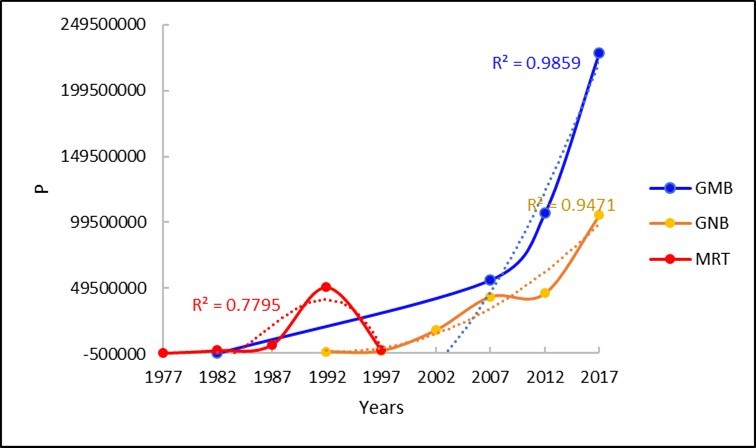
Figure 11.Trend of the net bilateral aid flows for the five countries .
Principal Component Analysis and Clustering Countries
The PCA shown in Figure 12 highlights that the active observations are clustered into three aggregates, namely, GMB, GNB and MRT (as Cluster I), MLI (as Cluster II) and SEN as (Cluster III). Among the variables in the first quadrant, GD neighbors PG and PD, as opposed to A and DG displayed in the third quadrant, while P, PA, G and D are positioned in the second quadrant. Migration (negative sign) is the only active variable in the fourth quadrant and distinguishes the members of Cluster I because of their reduced fluxes.
1Values are considered significant at P 0.05 > |0.372| r MD.G = -0.359
Figure 12.Principal component analysis of the endogenous and derivate variables and active observation (the five countries by year) reported in Table 2
Partial Least Squares (PLSR) Coefficients for the G-to-D Ratio within Clusters and Polydromic Coefficients
The solutions of the complete models are reported in Table 4, Table 5 for the three envisaged clusters.
The coefficient of the three clusters are reported in Table 6 as Polydromic coefficients for the G-to-D ratio.
Table 4. Correlation matrix of Table 2 (Pearson)1| Variables | G | M | A | D | GD | GD | P | PG | PD | PA |
| G | 1 | -0.375 | -0.463 | 0.877 | 0.41 | -0.411 | 0.94 | 0.488 | 0.644 | 0.868 |
| M | -0.375 | 1 | -0.142 | -0.489 | 0.104 | 0.114 | -0.309 | -0.169 | -0.064 | -0.211 |
| A | -0.463 | -0.142 | 1 | -0.204 | -0.626 | 0.509 | -0.494 | -0.605 | -0.787 | -0.542 |
| D | 0.877 | -0.489 | -0.204 | 1 | 0.088 | -0.265 | 0.723 | 0.357 | 0.339 | 0.583 |
| GD | 0.41 | 0.104 | -0.626 | 0.088 | 1 | -0.692 | 0.384 | 0.268 | 0.59 | 0.411 |
| DG | -0.411 | 0.114 | 0.509 | -0.265 | -0.692 | 1 | -0.334 | -0.373 | -0.487 | -0.314 |
| P | 0.94 | -0.309 | -0.494 | 0.723 | 0.384 | -0.334 | 1 | 0.607 | 0.777 | 0.975 |
| PG | 0.488 | -0.169 | -0.605 | 0.357 | 0.268 | -0.373 | 0.607 | 1 | 0.858 | 0.599 |
| PD | 0.644 | -0.064 | -0.787 | 0.339 | 0.59 | -0.487 | 0.777 | 0.858 | 1 | 0.812 |
| PA | 0.868 | -0.211 | -0.542 | 0.583 | 0.411 | -0.314 | 0.975 | 0.599 | 0.812 | 1 |
| Const. | M | A | D | P | PD | PG | LN(PA) | R2 | |
| Cl.I | 13.619 | 0.105 | -0.089 | -0.057 | -0.001 | 3.026 | -7.663 | 0.818 | 0.64 |
| Cl.II | 5.52 | -0.011 | 0.075 | 0 | 0.002 | 4.753 | -5.383 | -0.232 | 0.58 |
| CL.III | 19.711 | 0.019 | -0.142 | -0.017 | 0.002 | 2.779 | 48.822 | 0.693 | 0.99 |
| Clusters | M | A | D | P | PD | PG | LN(PA) |
| I- GMB, GNB, MRT - Entropic | 0.20 | -0.17 | -0.28 | -0.01 | 0.30 | -0.04 | 0.23 |
| II- MLI - Active | -0.29 | 0.16 | -0.03 | 0.31 | 0.48 | -0.03 | -0.11 |
| III- SEN - Reactive | 0.20 | -0.18 | -0.45 | 0.27 | 0.49 | 0.25 | 0.15 |
MLI shows a great benefit from the M and A factors in cluster II (active Country).
Country SEN excels for the maximum reaction to D decrease and shows high scores for the PG ratio in cluster III (reactive Country).
Countries GMB, GNB and MRT show a favorable reaction to a D decrease and negative influences from a higher A in cluster I (entropic Country).
In short, as far as Migration is concerned, an increase shows a positive response to MLI (Coeff. -0.29: active Country) and a slightly negative one to the others (0.20). Agriculture employment is apparently more favorable to the G-to-D ratio in MLI-active (0.16), but unfavorable to the others.
Importantly, the consequences of a decrease in D appears more favorable to the G-to-D ratio for SEN (-0.45: reactive Country), slightly favorable for GMB, GNB, MRT (-0.28) and not favorable at all for MLI (-0.03).
The G-to-D ratio is responsible for increasing Personal remises for MLI (0.31) and SEN (0.27).
Discussion
Clemens et al. 14 concluded, in their assessment, that: “the aid-growth literature does not currently possess a strong and patently valid instrumental variable with which to reliably test the hypothesis that aid strictly causes growth.” Despite some missing observations in this panel of five west African countries, especially in MRT, some interesting long-term results have emerged concerning the G-to-D ratio, a parameter that we have found as being a pivotal variable for efficiency, while the rule in panel for G growth is usually the inverse i.e. the D to G incidence as independent variable. The aforementioned Authors concluded that a 0.3÷ 0.5 percentage- point increase in investment/GDP and a 0.1÷ 0.2 percentage-point increase in growth of the real GDP per capita followed a one percentage-point increase in aid/GDP (at mean aid levels). Alemu and Lee 15 supported the theoretical hypothesis that a positive relationship between D and G growth exists, but only for low-income African countries, and not for middle-income ones. Galiani et al 16 confirmed that a 1% percent increase in the aid-to-gross net income ratio increases the real annual per capita GDP growth by 0.031%.
In the present sample of five West African countries, the growth appears more optimistic in the large interval that was considered, that is, at around +2.2%, when considering the G-to-D ratio, and also shows a favorable parabolic trend. However, it should be pointed out that the trend only becomes favorable in the new millennium.
Migration and Remittances
The effects of the migration (as net fluxes) returns on P are delayed over the years, thus the favorable raw Pearson correlations of M with P (-0.309 not significant) cannot account for time-lag effects. According to Rozelle et al 17, remittances are a positive function of migration.
Migration and Donors
As far as D and M are concerned, the correlation table reflects a general greater effort (D) to deter future migration (r D,M -0.489), where almost all the negative M net fluxes are ligated with a higher income from D. It should be noted that the DM correlation decreases slightly to a value that was recalculated at a parity of G (r D,M.G -0.359). Clemens and Postel 18 (2017) reached a similar conclusion from a wider panel (2678 observations in the1995-2013 interval) and observed that the relationship between D (X axis) and the Log of Emigration Rate (Y) was negative, even for different levels of Income. The same Authors pointed out that the capacity of aid to deter migration is limited at best. Aid can only encourage economic growth, employment and security to a limited extent. Beyond this, successful development in almost all formerly-poor countries has produced an increase in emigration. Moreover, Lanati and Thiele 19 wrote about the impact of foreign aid on revisited migration and found a negative correlation between the total aid a country obtains and its emigration rate. This evidence was also confirmed in most of the important empirical studies, similar to the results of Berthélemy et al 20, who studied the connection between the total aid received in a country and migration for a large cross section of developing countries.
In our analyses, we confirm that, in a long-term framework, migration acts like a magnet for donor aid. However, because of the weak and non-linear influence of migration on the GD ratio, our MLR model puts the partial coefficient of migration in the last position, with a nearly zero coefficient, and accounting for only 0.5% of the variance, thus supporting the independence of the average of G to D from migration.
Donor Aid and Remittances
It should be recalled that the average trend for the GD ratio, in current values, shows increasing values (+0.33 Y-1) with a parabolic acceleration over the years, and the level is somewhat higher for SEN (21.42; +68% vs. the others). The aid for development naturally appears in the national balances, since the variations in G in fact depend on D for more than 76%, while an even greater influence (over 88%) can be observed for the P source (Table 5). In this work, the importance of the P-to-D ratio for the GD donor efficiency has emerged (nearly 70%). The PD ratio is below 1 for many years in almost all the considered countries. However, after the first returns from migrants, the critical threshold is exceeded to a great extent, which is a sign that a real economic takeoff has begun. In fact, after maximizing overall, it appears that the variation in D raw efficiency, in the framework of the endogenous variates censed every five years, mainly depends on the PD ratio for about 70%, that is, a greater value than the P with D itself (R252%, Table 5). Thus, the main key for assessing economic efficiency appears to be the balance of the personal remittances with donor aid: a shift up of the numerator (P) as well as a shift down of the denominator (D) is ceteris paribus an advantage in the global raw efficiency chain. The yearly linear regression of +6.6% Y-1,and even more for the P-to-D ratio in the new millennium, may be a quite optimistic result, but this sample allows us to explain a different response from the three Clusters as a result of the variations in the D values. In fact, our aim was to discern countries according to their aptitude against variations in D. From this perspective, the polydromic GD coefficients for D distinguished the three clusters, enhancing a greater resilience for SEN (-0.45) than for GMB, GNM and MRT (-0.28) and for MLI (-0.03), which is a still active country as regard higher employment in agriculture.
On the other hand, Alemu and Lee 21 revealed that middle-income African countries tend to experience a greater impact on their economic growth from direct foreign investment and natural resource revenues, and oil exports in particular. In fact, the growth experienced in the five countries since the millennium seems to be due not only to exogenous forces, such as Donor aid and Personal remittances, but also to endogenous economic factors. Our study is in agreement with that of Minasyan et al 22,23, whose empirical results supported the hypothesis that higher remittances paid by donor countries strengthened the growth effects of foreign aid, especially where a more people-dedicated dual channel can be developed and the remises were dedicated to such solid familiar investments as land, building and culture. A concept that Clement and Postel (2017) also outlined is that donors could achieve a greater impact by leveraging on foreign aid in order not to deter migration, but to shape it for mutual benefits.
Conclusion
A long-term polydromic function can disentangle migration, agriculture employment and personal remittances to raise the GDP-to-Donor aid ratio in five African countries that have been grouped into three types: reactive to forcing factors, such as Donor diminutions (SEN), active, as driven by Personal remittance (MRT) and entropic (GMB, GNB, MRT), without any features of excellence. Lessons learnt from history suggests that variations in Donor aid can involve different evolutions of the GD ratio in the three clusters.
References
- 1. (2017) International Labour Organization. Employment. in agriculture (% of total employment) (modeled ILO estimate)
- 2.Kanu B S, Salami A O, Numasawa K. (2014) Inclusive growth: an imperative for African agriculture. , African Journal of Food, Agriculture, Nutrition and Development 14(3), 33.
- 3.A N Mukasa, A D Woldemichael, A O Salami, A M Simpasa. (2017) Africa’s Agricultural Transformation: Identifying Priority Areas and Overcoming Challenges. Africa Economic Brief.
- 4.FAO. (2015) The State of Food Insecurity in the World Meeting the 2015 interaction hunger targets: taking stock of uneven progress. Food and Agricultural Organization of the United Nations.
- 5.Food.Agriculture Organization of the United Nations (2011) The State of Food and Agriculture 2010–2011: Women in agriculture - Closing the gender gap for development. Rome: Food and Agricultural Organization of the United Nations.
- 6.Ceesay E. (2020) Employment in agriculture, migration, bilateral aids, economic growth, and remittance:. Evidence from the Gambia. Economics, Management and Sustainability 5(1), 48-67.
- 7.UNCTADALDCAFRICA2018. (2018) Economic Development in Africa Report 2018. Migration for Structural Transformation. In United Nations Conference on Trade and Development 1-204.
- 8.Engel J, Jouanjean M A. (2015) Political and economic constraints to the ECOWAS regional economic integration process and opportunities for donor engagement. EPA PEAKS–Economic and Private Sector, Professional and Applied Knowledge Services.
- 9.Næs T, Martens H. (1984) Multivariate calibration. II. Chemometric methods. , TrAC Trends in Analytical Chemistry 3, 266-71.
- 10.Pérez-Enciso M, Tenenhaus M. (2003) Prediction of clinical outcome with microarray data: a partial least squares discriminant analysis (PLS-DA) approach.Human genetics112. 581-92.
- 11.Zhang B, Ma J. (2011) Coal price index forecast by a new partial least-squares regression.Procedia. Engineering15 5025-9.
- 12.Meng M, Niu D. (2015) The relationship between energy consumption and economic growth in China: An application of the partial least squares method.Energy Sources, Part B: Economics, Planning, and. Policy10 75-81.
- 13.Vinzi V E, Trinchera L, Amato S. (2010) PLS path modeling: from foundations to recent developments and open issues for model assessment and improvement. In Handbook of partial least squares , Berlin, Heidelberg 47-82.
- 14.Clemens M A, Radelet S, RR Rikhil R Bhavnani, Bazzi S. (2012) Counting chickens when they hatch: the short-term effect of aid on growth.Economic. 122(561), 590-617.
- 15.Alemu A M, Lee J S. (2015) Foreign aid on economic growth in Africa: A comparison of low and middle-income countries.South. , African Journal of Economic and Management Sciences 18(4), 449-62.
- 16.Galiani S, Knack S, Xu L C, Zou B.The effect of aid on growth: Evidence from a quasi-experiment.Journal of Economic Growth.22(1). 1-33.
- 17.Rozelle S, J E Taylor, DeBrauw A. (1999) Migration, remittances, and agricultural productivity in China.American Economic Review89. 287-91.
- 18.Clemens M A, Postel H M. (2017) Deterring emigration with foreign aid: an overview of evidence from low-income countries. IZA Policy Paper.
- 19.Lanati M, Thiele R. (2018) The impact of foreign aid on migration revisited.World development111. 59-74.
- 20.Berthélemy J C, Beuran M, Maurel M. (2009) Aid and migration: Substitutes or complements?World. Development37 1589-99.
- 21.Alemu A M, Lee J S. (2015) Foreign aid on economic growth in Africa: A comparison of low and middle-income countries.South. African Journal of Economic and Management Sciences18 449-62.