
Effect of pH on Phytochemical and Antioxidant Potential of Satawar Tubers (Asparagus Racemosus Willd.)
Abstract
Plants are an important source of medicines since ancient times. The traditional system medicine’s use a variety of native plants to diagnose, prevent, and eliminate acute and chronic diseases.Asparagus racemosus(Willd.), also have been widely used for medicinal purpose and its extensively distributed in the tropics and subtropics of India, commonly known as Satawar, belongs to the family Asparagus. The purpose of this was to identify the phytochemicals and to assess the antioxidant potential in aqueous extracts prepared at different pH levels of Satawar tubers. The maximum amount of phenolics and flavonoids content was present at pH 9 i.e.18.88mg GAE/g and 2.83mg CE/g. The total antioxidant capacity was highest at pH 2 (15.96mg AAE/g) and IC50 values of DPPH free radical scavenging activity was the lowest at pH 7, 2582.85µg/mL. According to the whole study, this plant is a very good source of phytochemicals and acts as a powerful antioxidant.
Author Contributions
Academic Editor: Krishna KumaR, Defence Institute of High Altitude Research (DIHAR), Defence Research and Development Organization (DRDO), Ministry of Defence, C/o- 56 APO, Leh, 194 101, India.
Checked for plagiarism: Yes
Review by: Single-blind
Copyright © 2021 Parvesh Devi, et al.
 This is an open-access article distributed under the terms of the Creative Commons Attribution License, which permits unrestricted use, distribution, and reproduction in any medium, provided the original author and source are credited.
Competing interests
The authors have declared that no competing interests exist.
Citation:
Introduction
Plants have been a major source of medicines in ancient times, and are natural sources of anti oxidants and phytochemicals that act as secondary metabolites. In the system of traditional medicine, various native plants are to diagnose, prevent, and eliminate acute and chronic diseases.The current demand for herbal medicines, health products and pharmaceuticals worldwide is increasing 1. Asparagus racemosus(Willd.) also a very good medicinal plant and widely distributed in both tropical and subtropical region of India and is commonly known as Satawar and it belong to the Asparagus family. It is a succulent tuberous broadly branched bush with short roots 2. The Asparagus racemosus plant includes about 300 species worldwide, 22 of which are used in ancient Ayurvedic literature documented in India 3 and it is grown all over India. The plant prefers sandy, medium humus and heavy clay soils, the temperature required in the range of 25-40 °C for cultivation. Tuber parts of Asparagus root are of great importance for medicinal purposes compared to other parts of it and they have aphrodisiac, emollient, general tonic, diuretic, anti-inflammatory effects , antiseptic, antioxidant and antispasmodic and the root also treats infertility, impotence, leucorrhoea, menopausal syndrome, erectile dysfunction and some infectious diseases like herpes and frequent syphilis. It is also useful in treating epilepsy, kidney problems, chronic fever, excessive heat, stomach ulcers and liver cancer, increasing lactation in nursing mothers and regulating sexual behaviour 4.
The major bioactive constituents which are responsible for its medicinal value such as steroid saponins, quercetin, flavonoids, rutin, kaempferol and polyphenols 5. Therefore, the purpose of this study was to study the effect of different pH of aqueous extract on total phenol and flavonoid content and to evaluate the total anti oxidant capacity and DPPH free radical scavenging activity of Satawar (Asparagus racemosusWilld.) tubers. Satawar tubers have very high medicinal value and have great anti oxidant potential.
Material and Methods
Compilation of Plant Material
Satawar (Asparagus racemosusWilld.) tubers were collected from the Medicinal, Aromatic & Potential Crops Section, experimental area of the Department of Genetics & Plant Breeding on the campus of Chaudhary Charan Singh Haryana Agricultural University, Hisar (figure 1). Tuber samples were randomly collected from sites with plant age of approximately 1.5 years and dried in a tunnel drying system during the month of March. After drying, the samples were stored in a chemical laboratory. The samples were converted to powder form in a hammer mill.
Figure 1.Dried tubers of Satawar (Asparaguaracemosus)
Proximate Composition and Mineral Profile
According to the standard method outlined in the Official Association of Analytical Chemists (AOAC) 6, proximate analysis of turnip roots is carried out to determine moisture content, ash content, crude protein, total carbohydrates and calorific value. The crude fiber content is estimated using a modified Maynard method 7. The method of Burns 8 Vanillin HCl was used to estimate the tannin content as a catechin equivalent. The method described by Obadoni and Ochuko 9 and Ezeonuet et al was used to estimate the saponin content 10. The minerals (Fe, Cu, Mn and Zn) were estimated using Atomic Absorption Spectrophotometer (AAS), in acid digested plant samples by Jackson 11 and Ruig 12.
Preparation of Plant Extracts
A powder sample of 5 grams of Satawar tubers was packed into a thimble prepared from filter paper (Whatman No. 1) and extracted using a classic soxhlet extractor. In this apparatus equipped with a 500 mL round bottom flask and distilled water as solvent, half siphons (240-270 mL) of different pHs (2, 4,7and 9) were added and the pH was adjusted using conc. HCl and NaOH pellets. Extraction is carried out at the boiling point of the solvent. The solvent vapour condenses the heat in the rising condenser. After condensing, they overflow into a chamber containing a thimble containing a sample of Satawar tubers. When extraction was complete, each extract was filtered and this process was repeated 3 times, and then the obtained filtrate was stored in a storage container for further experiments.
Determination of Total Phenolic Content
Total phenolic content of aqueous extracts of different pHs, namely 2,4,7 and 9 Satawar tubers, was determined using the Folin Ciocalteu method. 13. For measurement of phenolic compounds; diluted each 0.2 mL extract with each solvent, adjust the absorbance within the correction range, added 1 mL Folin Ciocalteu reagent to the test tube, and add 2 mL Na2CO3 (20%, w /v). After mixing the final volume was made up to 10 mL with distilled water. The mixture was maintained for 8 minutes. Then centrifuge at 6000 rpm for 10 minutes.Similarly, blanks are prepared. Instead of samples, each solvent was taken. Thereafter, the absorbance of the supernatant was measured at 730 nm on a blank prepared by a UV-VIS double beam spectrophotometer model UV 1900 (Shimadzu Corporation). The total phenol content present in the aqueous extracts at different pHs was calculated from the calibration curve and expressed as mg GAE/g.
Estimation of Flavonoids
The flavonoid content of aqueous extracts of different pHs, namely 2, 4, 7 and 9 Satawar tubers, were determined using aluminum chloride colorimetric analysis 14. For the measurement of flavonoid compounds, 1 mL of each extract was taken and 4 mL of distilled water, 0.3 mL of NaNO2 (5%), and 0.3 mL of AlCl3 (10%) were added after 5 min. Then 2 mL of NaOH (1 M) was added immediately and the final volume was 10 mL with distilled water in a test tube. Similarly, blanks are prepared. Instead of samples, each solvent was used. After shaking the solution thoroughly, absorbance was measured at 510 nm on blanks prepared in UV-VIS double beam spectrophotometer model UV 1900 (Shimadzu Corporation). The amount of flavonoids that pH is present in other aqueous extracts is estimated from the standard curve and is expressed in mg CE / g.
Evaluation of Antioxidant Activity
Antioxidant activity was assessed with aqueous extracts of Satawar tubers at different pHs, namely 2,4,7 and 9, using the DPPH free-radical scavenging activity method 15. Record the weight of the completely dry mass of 10 mL aqueous extracts and re-dissolve the dry mass of the aqueous extract in an appropriate amount of 50% (v/v methanol:water) to make a 10000 µg/mL stock solution. Concentrations ranging from 10 µg/mL to 5000 μg/mL were prepared from stock solutions with appropriate dilutions with 50% (v/v) water : methanol. To assess DPPH free radical scavenger activity ; extracts of 1 mL at each concentration were taken then added 2 Ml of 2, 2’-diphenyl-1-picrylhydrazyl (DPPH; 0.1 mM prepared in 50% (v/v) water: methanol) and glass tube covered with a lid and shake thoroughly for 5 min.A control was made by using solvent in place of the sample. After culturing in a dark place for 30 minutes, they measured the absorbance of a blank containing pure methanol at 517 nm with UV-VIS Double Beam Spectrophotometer ( UV1900 Shimadzu), and each sample was taken to replication three times. Using Microsoft Excel software, graph a quadratic regression equation (y = ax² + bx + c) between the y-axis DPPH free radical scavenging activity (%) and the x-axis extract concentration (μg / mL). The resulting equation was converted to the form (ax² + bx + c = 0) with y = 50%. The IC50 value was calculated using the equation (ax² + bx + c = 0) by applying the following formula
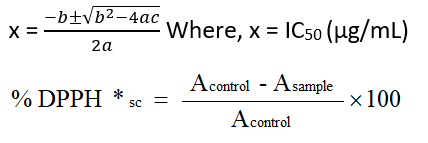
Where, Acontrol= control absorbance, Asample= sample absorbance
Total Antioxidant Capacity
For pH 2, 4, 7, and 9, the total antioxidant capacity of Satawar tubers from aqueous extracts was determined using the modified phosphomolybdenum method given by 16. For assessment of total antioxidant capacity; 1 mL of each extract was taken and 3 mL of phosphomolybdenum reagent was added to a glass vial covered with a lid and the solution was mixed thoroughly. They were cultured for 90 minutes. Absorbance was measured at at 95 ° C, then the contents of the vial were cooled and a blank prepared with UV-VIS Double Beam Spectrophotometer Model UV 1900 (Shimadzu) was measured at 695 nm. Similarly, blank was prepared and respective solvent was used instead of the sample. The pH is calculated from the standard curve and the total antioxidant capacity of other aqueous extracts is expressed in mg AAE / g.
Statistical Analysis
All experiments were performed in triplicate for statistical study and expressed as mean ± SD. One-way analysis of variance (ANOVA) was performed to assess significant differences between the means of the samples in online statistical analysis (OPSTAT). IC50 values of DPPH free radical scavenging activity were calculated using quadratic regression equations (Table 1). Correlations of total phenolics, total flavonoids, and DPPH free radical trapping IC50 values with total antioxidant capacity were determined using the Karl Pearson method in Microsoft Excel, and all other measurements were also performed in Microsoft Excel 2019.
Table 1. Proximate composition (%) of moisture, ash, fat, crude fibre, protein, total carbohydrates and calorific value (kcal) in tubers of Satawar| Parameters | Tubers |
|---|---|
| Moisture (%) | 3.67 ± 0.33 |
| Ash (%) | 7.67 ± 0.33 |
| Fat (%) | 2.23 ± 0.15 |
| Crude fibre (%) | 42.67 ± 1.20 |
| Protein (%) | 6.43 ± 0.35 |
| Total carbohydrates (%) | 43.00 ± 0.58 |
| Calorific value (kcal) | 213.83 ± 1.59 |
Results and Discussion
The characterization of raw materials is a mandatory step of determining the nutrient quality and value. Current study consists of two stages, in the first phase of Satawar tubers ready to analyze diet, chemistry and mineral components. Secondly, the extraction of the biometric active tuber compound of Satawar was performed at different pHs to evaluate the antioxidant activity. After that, the data were collected for statistical analysis and confirmed the level of importance. Consequences with the argument of the research properties discussed here.
Compositional Profiling
The nutritional composition of Satawar tubers was determined by proximity analysis. This work was conducted to evaluate the potential for nutritional and therapeutic usefulness of Satawar tuber rhizomes. In the present investigation, moisture, ash, crude fat, crude fiber, crude protein, total carbohydrate and calorific values were measured at the levels of 3.67 ± 0.33%, 7.67 ± 0.33%, 2.23 ± 0.15%, and 42.67 ± 1.20 %, 6.43 ± 0.35%, 43.00 ± 0.58%, 213.83 ± 1.59 kcal in tubers of Satawar (Table 1). The results obtained for compositional analyzes are comparable with Wagh et al 17. Bhakuni and Jain 18 found similar results for moisture, ash and total carbohydrates in Satawar tubers.
Chemical and Mineral Profile
In the current study, tubers analyzed by chemical analysis have a 19.48 ± 0.77 mg CE / g tannin content and a 3.51 ± 0.23% saponin content (Table 2). The results are consistent with previous studies such as Raval et al. 19 and Bhakuni and Jain 18 who reported the amounts of tannins and saponins in the range of 0.83 ± 0.9% and 5.4 ± 0.4%, respectively, However, the findings of Singla and Jaitak 20 were slightly different from current studies concerning Mn, Fe, Cu and Zn 5.0 to 62.0 mg/kg, 211.0 to 1493.0 mg/kg, 14.0to 23.0 mg/kg and 44.0 to 148.0 mg/kg respectively. These differences are due to the different effects of environmental factors on plants in different places.
Table 2. Chemical and Minerals analysis in ppm of Mn (manganese), Fe (iron), Cu (copper), and Zn (zinc) in powdered form of tubers of Satawar| Parameters | Tubers |
|---|---|
| Tannin (mg CE/g) | 0.79 ± 0.01 |
| Saponin (%) | 6.48 ± 0.04 |
| Mn (ppm) | 17.67 ± 1.38 |
| Fe (ppm) | 1305.00 ± 92.51 |
| Cu (ppm) | 26.67 ± 1.76 |
| Zn (ppm) | 145.33 ± 6.03 |
Total Phenolic Content
Using the formula (y = 0.0104x + 0.0079, R² = 0.9989), the calibration curve for gallic acid used as a standard dose of total phenol was determined in mg GAE/g of aqueous extracts at different pHs 2,4,7,9 of Satawar tubers. The highest phenol content was found at pH 9 (18.88), followed by pH 4 (9.32), pH 7 (2.41) and pH 2 (2.30 mg GAE / g). These results showed that wide variations in data at different pH and other researcher also find this type of variation. The phenol content first increased by raising the pH to 2-4, then decreased to pH 7, and then the pH increased.Phenolic compounds were extracted from Chamomile (Matricariapubescens) with pH 3,4,5,6,7 showing same type of trend, raising the pH to 3-5 also increases the phenol content, but decreases after pH 5. This shows that different extraction pH values significantly affect the extraction of phenolic compounds 21. In Tulsi leaf extract (Ocimum sanctum), the estimated phenols and their values varied with pH 2 (120 mg GAE/g), pH 7.2 (135 mg GAE/g) and pH 7.6 (75 mg GAE/g). It is clear that this may not be necessary, since increasing pH increases the amount of phenolic compounds and vice versa and they conclude that pH has a significant effect on the antioxidant activity of the methanolic O. sanctum leaf extract 22.
Total Flavonoids
Similarly, it was determined in mg CE/g using the formula (y = 0.0018x + 0.0038, R² = 0.998) obtained from a calibration curve for catechins used as standard doses of flavonoids. The flavonoid content was highest at pH 9 (2.83), followed by pH 2 (2.05), pH 4 (1.70), and pH 7 (0.55) mg CE/g, respectively. It was reported that the flavonoid content significantly changed the pH of the extraction solvent (water) and the order of the flavonoids measured in aerial parts of Schultz (Algerian MatricariaPubescens) as follows: pH 5 (6.36 ± 0.2 > pH 7 (4.88 ± 0.12)) > pH 6 (3.94 ± 0.17) > pH 4 (2.16 ± 0.17) > pH 3 (2.14 ± 0.19) 23. They also studied the effect of pH on the extraction yield of flavonoids in Citron (Citrus medica) bark extracts prepared in various organic solvents (methanol, ethanol, ethyl acetate, water) and observed that the extraction yield of flavonoids was also found to change at different pH values (3, 4, 5, 6, 7 and 8)24.
DPPH Radical Scavenging Activity
The DPPH free radical scavenging activity (%) and IC50value (µg/mL) of aqueous extractsof Satawar tubers at different pH levels of Satawar tubers are presented in (Table 3). Using the quadratic equation the IC50value for DPPH free radical scavenging activity was calculated in µg/mL in aqueous extracts with different pH, namely: 2, 4, 7 and 9 of the Satawar tubers. IC50 values were found to be lowest at pH 7 (2582.85), followed by pH 4 (3183.83), pH 2 (3246.50), pH 9 (4598.77 µg/mL) respectively. DPPH radical scavenging activity in methanol extract of peanut shells, studies and results obtained show higher activity at neutral and acidic pH 25. The alkaline pH of the coca by-product yielded the opposite result 26.
Table 3. DPPH free radical scavenging activity (%) and IC50value (µg/mL) of aqueous extracts of Satawar tubers at different pH levels| pH | DPPH free radical scavenging activity (%) at different concentration (µg/mL) | IC 50 (µg/mL) | |||||||||
| 10000 | 5000 | 2500 | 1000 | 500 | 250 | 100 | 50 | 25 | 10 | ||
| 2 | 76.35 | 63.70 | 42.77 | 21.54 | 14.00 | 10.69 | 6.48 | 5.12 | a | a | 3246.50 |
| 4 | a | 61.87 | 42.27 | 23.20 | 12.77 | 7.37 | 3.96 | 3.06 | 2.52 | 1.98 | 3183.83 |
| 7 | 77.35 | 76.21 | 47.09 | 12.14 | 11.49 | 8.25 | 6.31 | 4.37 | 2.27 | a | 2582.85 |
| 9 | 74.81 | 52.45 | 31.91 | 19.90 | 15.90 | 10.85 | 8.79 | 8.40 | a | a | 4598.77 |
Total Antioxidant Capacity
Calculated in mg AAE / g using the equation (y = 0.0066x + 0.0036, R² = 0.999) obtained from the ascorbic acid calibration curve used for standard total antioxidant capacity. Total antioxidant capacity was found to be highest at pH 2 (15.96), followed by pH 7 (15.03), pH 9 (9.32) and pH 4 (8.52) mg AAE / g respectively. Total antioxidant capacity by phosphomolybdenum method at different pH of in Date palm (Phoenix Dactylifera L.) was estimated and obtained results showing the difference in data and higher antioxidant capacity found at pH 4 (68.34 ± 0.71), followed by pH 6 (64.12) ± 1.08), pH 5 (63.62 ± 0.69), pH 7 (62.81 ± 0.73), pH 3 (55.92 ± 0.60) and pH 2 (55.11 ± 0. 60) 27. Graphically, the total phenolics, flavonoids and total antioxidant capacity data have been given below in figure 2.
Figure 2.Effect of different pHs on total phenolics, flavonoids and total antioxidant capacity of Satawar tubers in aqueous extract
Variations in the results of this phytochemical and antioxidant activity and total antioxidant capacity are likely due to changes in the pKa values of the reactions, and are related to the degree of ionization and deprotonation of functional group of the compound. Deprotonation of phenolic compounds can affect the thermodynamics of hydrogen atom delivery. 28, 29. All researchers have found significant differences in total antioxidant capacity at different pHs, as in current studies with data on phenol, flavonoids and antioxidant activity. The correlation coefficient was also calculated by Karl Pearson's method in Microsoft Excel, and Pearson's correlation coefficient was significantly negaeive when 0.61 ≤ r ≤ 0.97 and significantly positive when 0.61 ≤ r ≤ 0.97 30. Its values indicated a significant and positive correlation (r = 0.911; 0.925, P & lt; 0.01) between phenol and flavonoid content with IC50 of DPPH scavenging activity in Satawara tubers and had It was possible to predict that phenolic and flavonoid compounds are the main components of the antioxidant activity of Satawar tubers by the DPPH method. The total content of phenols and flavonoids along with their total antioxidant capacity was also significantly and negatively correlated (r = 0.817; 0.964, P & lt; 0.01) and could also predict that the compounds Phenolics and flavonoids are the main components of the total anti oxidant capacity of Satawar tubers by the phosphomolybdenum method.
Conclusion
From the above study, it could be concluded that the phytochemicals, free radical scavenging activity of DPPH and the total antioxidant capacity were significantly affected by the aqueous extracts prepared at different pHs. (2,4,7 and 9) and the results of the study data clearly indicate that different amounts of total phenols, flavonoids and antioxidants and free radical scavenging activity of DPPH have been demonstrated by aqueous extracts at different pH levels of Satawar tubers. The maximum content of flavonoids in the aqueous extract at pH 9 indicates that the pH value is an excellent factor for estimating flavonoids. Total antioxidant capacity at a pH greater than 2 indicates that it is the best for antioxidant capacity. The ability of scavenge free radicals by DPPH was highest at neutral pH, suggesting that at pH 7, Satawar tubers act as potent antioxidants. The Significant positive correlations between the IC50 of DPPH scavenging activity and phytochemicals and the significant negative correlation between total antioxidant capacity and phytochemicals suggested that phenolics and flavonoids were the main contributors to the total antioxidant capacity of Satawar tubers.
References
- 2.Purohit S S, Vyas S P. (2004) In: Aegle marmelos Correa ex Roxb,(Bael), Medicinal plant cultivation-A scientific approach. Agrobios. , Jodhpur 498-504.
- 3.Shaha P, Bellankimath A. (2017) Pharmacological profile of Asparagus racemosus: A review. , Int. J.Curr.Microbiol. App. Sci 6(11), 1215-23.
- 4.Alok S, S K Jain, Verma A, Kumar M, Mahor A et al. (2013) Plant profile, phytochemistry and pharmacology of Asparagus racemosus (Shatavari): A review. Asian Pacific journal of tropical disease. 3(3), 242-251.
- 5.D S Bhakuni, Jain S. (1995) Chemistry of cultivated medicinal plants-Withania somnifera Dunal Ashwagandha, Solanaceae. Advances in Horticulture Vol. 11-Medicinal and AromaticPlants.(Eds. KL Chadha, Rajendra Gupta) , New Delhi, India 115-19.
- 6.Horwitz W, Chichilo P, Reynolds H. (1970) Official methods of analysis of the Association of Official Analytical Chemists. Official methods of analysis of the Association of Official Analytical Chemists.
- 8.R E Burns. (1971) Method for estimation of tannin in grain sorghum 1. , AgronomyJournal 63(3), 511-512.
- 9.B O Obadoni, P O Ochuko. (2002) Phytochemical studies and comparative efficacy of the crude extracts of some haemostatic plants in Edo and Delta States of Nigeria. Global Journal of pure and applied sciences. 8(2), 203-208.
- 10.C S Ezeonu, C M Ejikeme. (2016) Qualitative and quantitative determination of phytochemical contents of indigenous Nigerian softwoods. , New Journal of Science
- 12.Ruig W G D, Collaborators. (1986) Atomic absorption spectrometric determination of calcium, copper, iron, magnesium, manganese, potassium, sodium, and zinc in animal feeding stuffs: interlaboratory collaborative studies. Gast CH Grimbergen AHM Guis B Hoekman BJ HoUman PCH Hoogh P de Huijbregts AWM Leeuwen J van Meer JM van der Moh Oey Teng Teunis GP Vertregt N Veen NG , Journal of the Association of Official Analytical Chemists 69(6), 1009-1013.
- 13.V L Singleton, J A Rossi. (1965) Colorimetry of total phenolics with phosphomolybdic-phosphotungstic acid reagents. , American journal ofEnologyand Viticulture 16(3), 144-158.
- 14.Ribarova F, Atanassova &52, M. (2005) Total phenolics and flavonoids in Bulgarian fruits and vegetables. , Journal of the university of chemical technology and metallurgy 40(3), 255-260.
- 15.Hatano T, Shintani Y, Aga Y, Shiota S, Tsuchiya T et al. (2000) Phenolic constituents of licorice. VIII. Structures of glicophenone and glicoisoflavanone, and effects of licorice phenolics on methicillin resistant Staphylococcus aureus. , Chemical and Pharmaceutical Bulletin 48(9), 1286-1292.
- 16.Prieto P, Pineda M, Aguilar M. (1999) Spectrophotometric quantitation of antioxidant capacity through the formation of a phosphomolybdenum complex: specific application to the determination of vitamin E. Analytical biochemistry. 269(2), 337-341.
- 17.D S Wagh, V S Kasture, S. (2014) Phytochemical evaluations of marketed Shatavari formulations and development of analytical methods for saponins contents. , International Journal of Research in Pharmacy and Chemistry 4(3), 673-680.
- 18.D S Bhakuni, Jain S. (1995) Chemistry of cultivated medicinal plants. Advances in horticulture 11, 98-99.
- 19.P K Raval, Nishteshwar K, B R Patel, V J Shukla. (2012) Asparagus racemosus Willd.–“A Comparative Phytochemical Analysis of Fresh Dried Roots of Shatavari”. , International Journal of pharmaceutical and biological archives 3(6), 1458-1461.
- 20.Singla R, Jaitak V. (2014) . , SHATAVARI (ASPARAGUS RACEMOSUS WILD): A REVIEW ON ITS CULTIVATION, MORPHOLOGY, PHYTOCHEMISTRY AND PHARMACOLOGICA IMPORTANCE. International Journal of Pharmacy & Life Sciences 5(3).
- 21.Altunkaya A, Gökmen V, L H Skibsted. (2016) pH dependent antioxidant activity of lettuce (L. sativa) and synergism with added phenolic antioxidants. Food chemistry. 190, 25-32.
- 22.Padmaja M, Srinivasulu A. (2016) Influence of pH and temperature on total phenol content of Ocimum sanctum leaves. , Indian Journal of Pharmaceutical Science & Research 6(2), 69-72.
- 23.L S Eddine, Djamila B, O M Redha. (2016) Solvent pH extraction effect on phytochemical composition and antioxidant properties of Algerian Matricaria Pubescens. , Journal of Pharmacy Research 10(2), 106-112.
- 24.M P Nandan, Vangalapati M. (2015) Phytochemical analysis and effect of various parameters on the extraction yield of flavonoids from theCitrus medicaL. peel extract.International. , Advanced Research Journal in Science, Engineering and Technology 2(9), 5-9.
- 25.G C Yen, P D Duh. (1993) Antioxidative properties of methanolic extracts from peanut hulls. , Journal of the American Oil Chemists' Society 70(4), 383-386.
- 26.Azizah A H, Ruslawati N N, Tee T S. (1999) Extraction and characterization of antioxidant from cocoa by-products. , Food Chemistry 64(2), 199-202.
- 27.Zohra R, O M Redha, L S Eddine. (2016) Evaluation of phenolic content and antioxidant capacity of leaf extract from Phoenix Dactylifera L. obtained by different pH of aqueous extraction. , Journal of Pharmacy Research 10(1), 1-7.
- 28.Lemańska K, Szymusiak H, Tyrakowska B, Zieliński R, A E Soffers et al. (2001) The influence of pH on antioxidant properties and the mechanism of antioxidant action of hydroxyflavones. , Free Radical Biology and Medicine 31(7), 869-881.
Cited by (8)
This article has been cited by 8 scholarly works according to:
Citing Articles:
Clean Technologies and Environmental Policy (2024) OpenAlex
Clean Technologies and Environmental Policy (2024) Crossref
Processes (2024) OpenAlex
Journal of Medicinal Plants Studies (2023) OpenAlex
International Journal of Molecular Sciences (2023) OpenAlex
Monika Moond, Sushila Singh, Seema Sangwan, S. Rani, Anu Beniwal et al. - International Journal of Molecular Sciences (2023) Semantic Scholar
Antibiotics (2022) OpenAlex
A. Miranda, Tamara Akpobolokemi, Etelka Chung, G. Ren, B. Raimi-Abraham - Antibiotics (2022) Semantic Scholar