
Evaluation of Anti-oxidation and Therapeutic Effect of Biofield Energy Healing Based Novel Test Formulation Using TNBS (Tri Nitro Benzene Sulfonic Acid) - Induced Ulcerative Colitis in Sprague Dawley Rats
Abstract
The aim of the study was to evaluate the antioxidant potential of Biofield Energy Healing (the Trivedi Effect®) based test formulation using TNBS-induced colitis animal model. Each ingredient of the test formulation was divided into two parts. One part was denoted as the control without any Biofield Energy Treatment, while the other part was treated with Biofield Energy Treatment by Mr. Mahendra Kumar Trivedi and defined as the Biofield Energy Treated test formulation. The colon tissue was used for the estimation of anti-oxidation activity for catalase (CAT), glutathione (GSH), lipid peroxidation (LPO) product, myeloperoxidase (MPO), superoxide dismutase (SOD), and glutathione peroxidase (GPx) using standard procedure. The antioxidant results showed that the CAT level was significantly increased by 95.4% (p≤0.001), 72.3%, 47.6%, and 13.9% in the Biofield Energy Treated test formulation (G5), Biofield treatment per se to animals (-15 days)(G6), Biofield Energy Treatment per se to animals plus Biofield Energy Treated test formulation (-15 day) (G8), and Biofield Energy Treatment per se to animals plus untreated test formulation (G9) groups, respectively as compared to the untreated test formulation group (G4). Further, colon GSH activity was found to be significantly increased by 23.2% (p≤0.05) 15.4%, and 15.5%, in G5, G6, and G9 groups, respectively with respect to G2 group. In addition, colon LPO activity data suggested that it was decreased by 12%, 17%, 18%, and 19.1% in G5, G6, Biofield Energy Treated test formulation (-15 day) (G7), and G8 groups, respectively, as compared with the G2 group. The level of MPO showed a significant (p≤0.001) reduced level by 27.9%, 22%, 14.5%, 16.6%, and 25.3% in G5, G6, G7, G8, and G9 groups, respectively as compared with the G2 group. The level of colon SOD was increased by 16.7% and 14.2% in the G5 and G9 groups, respectively as compared with the untreated test formulation, G4 group. Colon GPx level was increased by 177.6%, 71.4%, 71.4%, 161.2%, and 114.3% in G5, G6, G7, G8, and G9 groups, respectively as compared with the G2 group. Thus, it can be concluded that the Trivedi Effect®-Consciousness Energy Healing based test formulation and Biofield Energy per se has significant colon anti-oxidation profile, which can be used to improve many autoimmune and inflammatory diseases, stress management and prevention, and anti-aging by improving overall health.
Author Contributions
Academic Editor: Raj Kishori, Department of Genetics and Plant Breeding, , CSIR, Lucknow, India.
Checked for plagiarism: Yes
Review by: Single-blind
Copyright © 2021 Mahendra Kumar Trivedi, et al.
 This is an open-access article distributed under the terms of the Creative Commons Attribution License, which permits unrestricted use, distribution, and reproduction in any medium, provided the original author and source are credited.
Competing interests
The authors have declared that no competing interests exist.
Citation:
Introduction
Gut health and the role of antioxidants play a magical mechanism on the lining of the gut, protect the cells lining the gut by managing and controlling different level of inflammation, and also support the growth of healthy flora in gut 1. In addition, antioxidants also improve and support the gut-healing strategies such as prebiotics and probiotics 2. Thus, antioxidants are the best gut-healing diet, which protect the gut lining epithelial cells, which allows entering the good foodstuffs and keeping out the dangerous bacteria that might cause various inflammatory diseases. The role of antioxidants in H. pylori infection prevents to die the gut lining and protect it, which might results in chronic and other autoimmune diseases 3. In addition, antioxidants (dietary polyphenols) provide supports to the gut microbiome, gut biome, or gut microbiota by encouraging the growth of helpful microbes, and discourage the growth and survival of dangerous bacteria. Antioxidants are regarded as one important part of a gut-health diet. They enhance the working of pre and pro-biotic (gut-healing therapies). A new advanced cobiotic has been introduced which is the combination of antioxidant and the prebiotic, which play a vital role in gut health 4. Thus, consumption of nutrients, foods, and other health supplements can enhance the gut health as it provide energy to vital organs and helps in protection against infectious and inflammatory complications 5. It was found that gut has also the major vascular, neuronal, lymphatic, and immune networks in the body. Gastrointestinal tract and gut mucosa is in direct contact with the microbial antigens and allergic invasions, which protect the proliferation and colonization of unfriendly microbes and related toxins. Microbiota imbalance results in increased gut permeability to toxins, dysbiosis, and states of inflammatory diseases. In addition, dysbiosis leads to the dysregulated antioxidants and related reactive oxygen species (ROS), mostly due to excess release from the neutrophils and other immune defense cells 6. Thus, a novel proprietary product as a complementary approach was formulated to improve the gut health, which is the combination of minerals and vitamins such as zinc chloride, ferrous sulphate, copper chloride (II-cupric), magnesium (II) gluconate vitamin B6 (pyridoxine HCl), vitamin B12 (cyanocobalamin), and cholecalciferol (Vit. D3).
Complementary and Alternative Medicines (CAMs) are one of the different segments of medicine and has shown significant results in exogenous antioxidants, which has become increasingly popular in the developed world 7, 8. Biofield Energy Based Treatment is acceptance worldwide and National Center for Complementary and Alternative Medicine (NCCAM) has been inaugurated as the United States Federal Government’s lead agency for conducting scientific research and practicing in the arena of medicine 9, 10. Biofield Energy Healing Treatment as a CAM approach against various disease conditions has been recommended by National Institute of Health (NIH) using different Energy therapies such as natural products, deep breathing, yoga, Tai Chi, Qi Gong, healing touch, pilates, chiropractic/osteopathic manipulation, acupressure, special diets, acupuncture, Reiki, cranial sacral therapy meditation, massage, essential oils, aromatherapy, movement therapy, hypnotherapy, mindfulness, homeopathy, Ayurvedic medicine, guided imagery, relaxation techniques, progressive relaxation, naturopathy, traditional Chinese herbs and medicines, and applied prayer (as is common in all religions, like Christianity, Hinduism, Buddhism and Judaism) 11, 12, 13. Every living organism possess some kind of unique energy that can be harnessed and convey it into other living and non-living things by the process of Biofield Energy Healing by altered atomic/molecular weight through possible mediation of neutrinos 14. Biofield Energy Healing Treatment (the Trivedi Effect®- Consciousness Energy Healing) have been studied and reported with significant outcomes in various scientific disciplines such as microbiology with altered antimicrobial sensitivity against pathogenic microbes 15, 16, 17, genetics 18, 19, skin health 20, 21, bone health 22, 23, 24 agricultural science 25, 26, immunity 27, 28, pharmaceuticals 29, 30, and materials science 31, 32. In the present study, the authors evaluated the impact of the Biofield Energy (the Trivedi Effect®-Consciousness Energy Healing) Treatment on the novel proprietary formulation for its anti-oxidation action using standard assays using TNBS (Trinitrobenzenesulphonic acid)-induced ulcerative colitis in experimental rat model.
Materials and Methods
Chemicals and Reagents
Copper chloride, cholecalciferol (vitamin D3), sodium carboxymethyl cellulose (Na-CMC), sulphasalazine, and iron (II) sulfate were procured from Sigma-Aldrich, USA. Pyridoxine hydrochloride (vitamin B6), zinc chloride, cyanocobalamin (vitamin B12), and magnesium (II) gluconate were purchased from TCI, Japan. TNBS (Trinitrobenzenesulphonic acid) was purchased from HiMedia, India. All the other chemicals used in this experiment were analytical grade procured from India.
Experimental Animals
Randomly breed male Sprague Dawley (SD) rats with body weight around 220 to 350 gm were used in this study. The animals were purchased from M/s. National Institute of Biologicals, India. Animals were randomly divided into nine groups based on their body weights consist of eight animals of each group. They were kept individually in sterilized polypropylene cages with stainless steel top grill having provision for holding pellet feed and drinking water bottle fitted with stainless steel sipper tube. The animals were maintained as per standard protocol throughout the experiment.
Consciousness Energy Healing Strategies
The each ingredient of the novel test formulation was divided into two parts. One part of each ingredient was considered as control, where no Biofield Energy Treatment was provided. Another part of each ingredient received Biofield Energy Treatment by Mr. Mahendra Kumar Trivedi (known as the Trivedi Effect®) under laboratory conditions for ~3 minutes. In addition, three different test group as per experimental protocol, the animals were also received Biofield Energy Treatment under laboratory conditions for ~3 minutes. The blessing/treatment was given to the remotely without touching in the laboratory of Dabur Research Foundation, near New Delhi, India. Similarly, the control samples were subjected to “sham” healer under the same laboratory conditions for ~3 minutes. The “sham” healer did not have any knowledge about the Biofield Energy Treatment. After that, the Biofield Energy Treated samples were kept in the similar sealed condition. The Biofield Energy Treated animals were also taken back to the animal experimental room for further proceedings.
Experimental Test Groups
The gut health oxidative stress biomarkers experiment was divided into 9 animals per groups from G1 to G9. G1 denoted as normal control with vehicle (0.5% CMC), G2 group defined as colitis control, with 50% TNBS in ethanol using intra colonic route, G3 group include reference compound i.e. sulfasalazine (250 mg/kg), G4 group included administration of untreated test formulation, G5 include Biofield Energy Treated test formulation, G6 group denoted as Biofield Energy Treatment per se to the animals (Day -15) along with vehicle (0.5% CMC), G7 group defined as Biofield Energy Treated test formulation from day -15, G8 group included Biofield Energy Treatment per se to the animals along with Biofield Energy Treated test formulation from day -15, and G9 group animals were administered with the Biofield Energy Treatment per se (day -15) to the animals along with the untreated test formulation. 50% TNBS in ethanol was given to the entire test group except G1.
Detailed Experimental Procedure
Five days after acclimatization, animals were randomized and grouped based on their body weight. Groups G1, G2 and G6 were treated with 0.5% w/v CMC-Na in distilled water for 8 weeks (Day 1 to 56). Group 3 was treated orally with sulphasalazine (reference item) at a dose of 250 mg/kg body weight for 8 weeks. The freshly prepared suspensions of untreated and Biofield Energy Treated Test formulation were administered orally to the G4 and G5 groups at a dose of 130.525 mg/kg for 8 weeks. Similarly, group G7 and G8 group were treated with the test formulation at a dose of 130.525 mg/kg from the day of Biofield Energy Treatment (day -15 to 56), while in group G9, Biofield Energy Treated animals were treated with untreated test formulation for 8 weeks. Before the induction of experimental colitis, a short fasting preceded. The duration ranged from 12 to 18 hours, while the chronic colitis was induced by intra colonic administration of TNBS-50% ethanol in a total volume of 400 μL, at a dose of 10 mg/rat. TNBS was instilled by a suitable medical-grade polyurethane catheter for enteral feeding approximately 8 cm proximal to the anal verge. Accordingly, TNBS injection was given on day 1, 8, 15, 21, 27, 34, 40, 48, and 54. After the end of the experiment, the colon was subsequently divided longitudinally into different pieces, homogenized and stored in -80°C for estimation of oxidative stress biomarker such as LPO, anti-oxidant enzymes such as MPO, SOD, Catalase, GSH, and GPx.
Assessment of Oxidative Stress Markers
All the animals in various groups after the treatment with the untreated and Biofield Energy Treated test formulation till 8 weeks were examined for antioxidant assay. In order to test the major oxidative stress biomarkers, colon of all the animals was subsequently collected in each animal of various groups. The colon was divided longitudinally into different pieces, homogenized, and stored in -80°C for further testing of oxidative biomarkers using standards kits. The colon homogenate (100 mg tissue/mL) was subjected to the analyses of biomarkers testing. The detailed test procedure of manufactured instructions were used for the identification of oxidative stress biomarkers such as LPO along with anti-oxidant enzymes viz. MPO, SOD, Catalase, GSH, and GPx. Following kits such as rat myeloperoxidase (MPO) ELISA, LPO TBARS (TCA Method) Assay Kit, glutathione assay kit, glutathione peroxidase assay kit, superoxide dismutase assay kit, and catalase assay kit as per manufacturer instructions.
Statistical Analysis
The data were expressed as mean ± standard error of mean (SEM) and subjected to statistical analysis using SigmaPlot (Version 11.0). For between two groups comparison Student’s t-test was performed, while multiple groups analysis one-way ANOVA was performed followed by post hoc analysis by Dunnett’s test. The p≤0.05 was considered as statistically significant (n=8).
Results and Discussion
Assessment of Catalase in Colon
The results of CAT activity after treatment using novel test formulation are presented in Figure 1. The catalase activity in the colon of rats treated with TNBS (G2) was 111.45 ± 16.07 nM/min/mL, which was significantly (p<0.05) lower than that of the control (G1) group 162.90 ± 13.59 nM/min/mL. However, the animals treated with the Biofield Energy Treatment per se, different combinations of Biofield Energy Treated and untreated test formulation to the Biofield Energy Treated and untreated TNBS induced animals including reference compound (sulphasalazine, G3) significantly altered the CAT activity. The reference compound, sulphasalazine that was treated with animals in G3 group treatment significantly decreased the catalase activity (68.78 ± 7.20 nM/min/mL). In addition, the untreated test formulation to the untreated animals in G4 group showed decreased CAT activity (58.94 ± 11.77 nM/min/mL). The results showed that the level of catalase was reduced by 29.3%, 37.7%, 73.9%, 46.6%, and 58.8% in G5, G6, G7, G8, and G9 groups, respectively as compared with the diseases control group (G2). However, the level of CAT was significantly increased by 95.4% (p≤0.001), 72.3%, 47.6%, and 13.9% in the G5, G6, G8, and G9 groups, respectively as compared to the untreated test formulation group (G4). CAT is the powerful antioxidant enzyme, also known as the longevity enzyme, which protect from free radicals in the body. CAT also play a significant role in ulcerative colitis, gut health, along with various powerful action as anti-aging and anti-degenerative effects, fat reduction, improve quality of life, and also helps in prevention of DNA damage 33. Therefore, the Trivedi Effect®-Biofield Energy Treated novel test formulation has significant powerful antioxidant action, which leads to improve gut health and its related inflammatory disorders.
Figure 1.The effect of the Biofield Energy Treated test formulation for the assessment of catalase (CAT) enzyme activity in colon tissue. G1: Normal control; G2: Disease control (50% TNBS in ethanol, (10 mg); 400 µL through intra-colonic route); G3: Sulphasalazine, 250 mg/kg; G4: Untreated test formulation; G5: Biofield Energy Treated test formulation; G6: Biofield treatment per se to animals (-15 days); G7: Biofield Energy Treated test formulation (-15 day); G8: Biofield Energy Treatment per se to animals plus Biofield Energy Treated test formulation (-15 day); and G9: Biofield Energy Treatment per se to animals plus untreated test formulation. All the values are represented as mean ± SEM (n=8). *p≤0.05 vs. G1 and ***p≤0.001 vs. G4.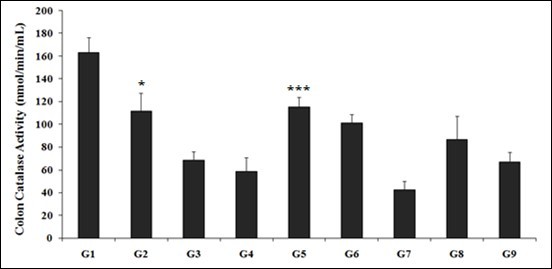
Effect of the Test Formulation for the Estimation of Colon GSH Activity
The data suggested that GSH level was depleted after intestinal injury in rat’s induced by TNBS. The level of GSH in the animal colon treated with the TNBS (G2) was 89.87 ± 6.11 µM, which was similar than that of the control (G1) group 90.03 ± 4.09 µM (Figure 2). Slightly increased in GSH level was observed in G3, G4, G5, G6 and G9 groups except group G7 and G8, which showed decreased of GSH level.In our study, we found significant changes in the activity of GSH in the colonic tissue of the TNBS-induced colitis group. GSH activity was found to be significantly increased by 23.2% (p≤0.05) 15.4%, and 15.5%, in groups G5, G6, and G9 groups, respectively as compared with the G2 group. However, GSH activity was found to be increased by 16%, 8.7%, and 8.8% in groups G5, G6, and G9 groups, respectively with respect to untreated test formulation, G4.
Figure 2.The effects of the Biofield Energy Treated test formulation for the assessment of GSH activity in colon tissue. G1: Normal control; G2: Disease control (50% TNBS in ethanol, (10 mg); 400 µL through intra-colonic route); G3: Sulphasalazine, 250 mg/kg; G4: Untreated test formulation; G5: Biofield Energy Treated test formulation; G6: Biofield treatment per se to animals (-15 days); G7: Biofield Energy Treated test formulation (-15 day); G8: Biofield Energy Treatment per se to animals plus Biofield Energy Treated test formulation (-15 day); and G9: Biofield Energy Treatment per se to animals plus untreated test formulation. All the values are represented as mean ± SEM (n=8). *p≤0.05 vs. G2.
GSH regulates the antioxidant mechanism of the body and helps to develop gut immunity, which would improve the pathogenic condition of ulcerative colitis 34. Thus, Biofield Energy Treated test formulation would be a promising candidate for ulcerative colitis and improve the antioxidant activity.
Effect of the Test Formulation for the Estimation of Colon LPO (MDA) Activity
The elevated LPO levels in the colon has been found to be related with triggering the cascade of reactions, which initiate more and more free radical generation that wear out the antioxidant defense and results in the development of ulceration and inflammation. The experimental data suggested that malondialdehyde (MDA) level was significantly higher in the colitis control group (G2) suggesting an oxidative stress in colon. The level of LPO in the colon of rats was found to be significantly decreased in all the treatment groups, indicating less free radical generation. The LPO level in the colon of rats treated with TNBS (G2) was 3.94 ± 0.19 µM, which was significantly higher (p<0.001) than that of the control (G1) group 2.74 ± 0.13 µM (Figure 3). In addition, data suggested significant decreased (p<0.05, 3.01 ± 0.32 µM) in the level of LPO in sulphasalazine treated group (G3) as compared to the G2 group. However, the animals showed decreased LPO by 12%, 17%, 18%, 19.1%, and 3.2% in G5, G6, G7, G8, and G9 groups, respectively as compared with the G2 group.
Figure 3.The effects of the Biofield Energy Treated test formulation for the assessment of lipid peroxidation (LPO) product in colon tissue. G1: Normal control; G2: Disease control (50% TNBS in ethanol, (10 mg); 400 µL through intra-colonic route); G3: Sulphasalazine, 250 mg/kg; G4: Untreated test formulation; G5: Biofield Energy Treated test formulation; G6: Biofield treatment per se to animals (-15 days); G7: Biofield Energy Treated test formulation (-15 day); G8: Biofield Energy Treatment per se to animals plus Biofield Energy Treated test formulation (-15 day); and G9: Biofield Energy Treatment per se to animals plus untreated test formulation. All the values are represented as mean ± SEM (n=8). *p≤0.05 vs. G2 and ***p≤0.001 vs. G1.
LPO affects the cellular membranes, lipoproteins, and other related molecules containing the lipids in accordance with the oxidative stress. A cellular membrane lipid represents most often substrates of oxidative attack and is regarded as one the vital step in the pathogenesis of various disease states. Thus, Biofield Energy Treated test formulation would improve the antioxidant activity by reducing the LPO level in colon.
Effect of the Test Formulation for the Estimation of Colon MPO Activity
Neutrophil infiltration is one of the most remarkable histological findings in the inflamed colonic tissue of IBD. The MPO is an indicator for leukocyte infiltration, which is commonly found in inflamed tissue such as chronic processes like neurodegenerative diseases and atherosclerosis 35. MPO activity was significantly induced by TNBS administration, while the MPO level in the rat colon was found to be significantly decreased in all the treatment groups and well corroborated by the significant decrease in inflammatory cell infiltration in the G4, G7, G8 and G9 groups (Figure 4), which indicated that Biofield Energy Treated and the novel test formulation ameliorates the colon inflammation. The experimental results showed that MPO level in the colon of rats treated with TNBS (G2) was 45.97 ± 1.19 ng/mL, which was significantly higher than that of the control (G1) group 24.45 ± 0.66 ng/mL (p<0.001). Sulphasalazine treatment (G3) significantly reduced (p<0.001) MPO level (37.80 ± 0.91 ng/mL) by 17.8% as compared by G2. However, G4 showed significantly decreased the MPO level (33.00 ± 0.95 ng/mL) by 28.2% as compared with G2. G5 group showed a significantly decreased (p<0.001) MPO level (33.13 ± 1.02 ng/mL), while G6 group also revealed significant decreased (p<0.001) MPO level (35.84 ± 1.33 ng/mL) by 27.9% and 22% respectively, as compared with G2. Further, 15 days pre-treatment of the Biofield Energy Treated test formulation (G7) significantly decreased MPO level (39.31 ± 2.30 ng/mL) by 14.5% as compared with G2, while G8 and G9 group showed a significant decreased level of MPO by 16.6% and 25.3% respectively, as compared with the G2.
Figure 4.The effects of the Biofield Energy Treated test formulation for the assessment of myeloperoxidase (MPO) activity in colon tissue. G1: Normal control; G2: Disease control (50% TNBS in ethanol, (10 mg); 400 µL through intra-colonic route); G3: Sulphasalazine, 250 mg/kg; G4: Untreated test formulation; G5: Biofield Energy Treated test formulation; G6: Biofield treatment per se to animals (-15 days); G7: Biofield Energy Treated test formulation (-15 day); G8: Biofield Energy Treatment per se to animals plus Biofield Energy Treated test formulation (-15 day); and G9: Biofield Energy Treatment per se to animals plus untreated test formulation. All the values are represented as mean ± SEM (n=8). ###P≤0.001 vs. G1, $$$P≤0.001 vs. G2, and ***p≤0.001 vs. G2.
Effect of the Test Formulation for the Estimation of Colon SOD Activity
The experimental data suggested significant increased levels of SOD in colitis control rats (G2) validating the results of oxidative stress in the colon (Figure 5). The SOD activity in the colon rats treated with TNBS (G2) was 0.587 ± 0.021 U/mL, which was significantly higher than that of the control (G1) group 0.358 ± 0.037 U/mL (p<0.001). Sulphasalazine treatment (G3) decreased SOD level (0.525 ± 0.021 U/mL), G4 group showed decreased SOD level (0.483 ± 0.049 U/mL), G5 also showed decreased SOD level as compare to the colitis control (0.564 ± 0.033 U/mL), G6 group showed a decreased the SOD level (0.415 ± 0.040 U/mL) as compared with G2. G7 group showed a decreased the SOD level (0.365 ± 0.072 U/mL), G8 also revealed a decreased SOD level (0.397 ± 0.058 U/mL) and G9 also showed a decreased SOD level (0.552 ± 0.023 U/mL) as compared with the G2 group. The level of SOD in the colon of rats was found to be decreased by 10.6%, 17.6%, 3.8%, 29.3%, 37.8%, 32.2%, and 5.9% in the G3, G4, G5, G6, G7, G8, and G9 groups respectively, as compared with the G2 group. In addition, SOD level was increased by 16.7% and 14.2% in the G5 and G9 groups, respectively as compared with the untreated test formulation, G4 group.
Figure 5.The effects of the Biofield Energy Treated test formulation for the assessment of superoxide dismutase (SOD) activity in colon tissue. G1: Normal control; G2: Disease control (50% TNBS in ethanol, (10 mg); 400 µL through intra-colonic route); G3: Sulphasalazine, 250 mg/kg; G4: Untreated test formulation; G5: Biofield Energy Treated test formulation; G6: Biofield treatment per se to animals (-15 days); G7: Biofield Energy Treated test formulation (-15 day); G8: Biofield Energy Treatment per se to animals plus Biofield Energy Treated test formulation (-15 day); and G9: Biofield Energy Treatment per se to animals plus untreated test formulation. All the values are represented as mean ± SEM (n=8). ***p≤0.001 vs. G1.
SOD is the antioxidant enzyme, which constitute the first line of defense against deleterious effects of oxy-radicals in all the living cells. SOD breaks down the most dangerous free radical superoxide anion to molecular oxygen and hydrogen peroxide and prevents subsequent formation of hydroxyl radicals and plays an important role in the cellular antioxidant mechanism. It also prevents the oxidative hazards and prevents the generation of hydroxyl radical and protects cellular constituents from oxidative damage. It possesses a powerful anti-inflammatory activity against chronic inflammation. The scientific data suggested that SOD enzyme supplement treatment reduced the ROS generation, oxidative stress and also inhibits the endothelial activation 36. Thus, Biofield Energy Treatment would be the best alternative treatment approach to treat ulcerative colitis using improved anti-oxidation action.
Effect of the Test Formulation for the Estimation of Colon GPx Activity
The GPx activity in the colon of rats treated with TNBS (G2) was 222.86 ± 101.39 nM/min/mL, which was lower than that of the control (G1) group 477.55 ± 131.27 nM/min/mL (Figure 6). Sulphasalazine (G3) group showed an increased GPx activity (382.04 ± 117.90 nM/min/mL). G4 group showed an increased GPx activity (445.71 ± 93.21 nM/min/mL), G5 group showed an increased GPx activity (618.54 ± 155.79 nM/min/mL), G6 group showed an increased GPx activity (382.04 ± 83.37 nM/min/mL) as compared with G2. G7 group showed an increased GPx activity (382.04 ± 83.37 nM/min/mL), G8 group showed an increased GPx activity (582.15 ± 173.22 nM/min/mL), and G9 group data showed an increased GPx activity (477.55 ± 101.39 nM/min/mL) as compared with the G2 group. Overall, the data suggested that GPx level was increased by 177.6%, 71.4%, 71.4%, 161.2%, and 114.3% in G5, G6, G7, G8, and G9 groups, respectively as compared with the G2 group. In addition, GPx level was significantly increased by 38.8%, 30.6%, and 7.1% in G5, G8, and G9 groups, respectively as compared with the untreated test formulation, G4 group.
Figure 6.The effects of the Biofield Energy Treated test formulation for the assessment of glutathione peroxidase (GPx) activity in in colon tissue. G1: Normal control; G2: Disease control (50% TNBS in ethanol, (10 mg); 400 µL through intra-colonic route); G3: Sulphasalazine, 250 mg/kg; G4: Untreated test formulation; G5: Biofield Energy Treated test formulation; G6: Biofield treatment per se to animals (-15 days); G7: Biofield Energy Treated test formulation (-15 day); G8: Biofield Energy Treatment per se to animals plus Biofield Energy Treated test formulation (-15 day); and G9: Biofield Energy Treatment per se to animals plus untreated test formulation. All the values are represented as mean ± SEM (n=8).
The scientific data suggested that an improved GPx level reduced the free radicals, ROS generation, oxidative stress, which results in inhibition of inflammatory ulcerative colitis condition 36. Thus, Biofield Energy Treatment would be the best alternative treatment approach to treat ulcerative colitis using improved anti-oxidation action. This would lead to improve various diseases conditions such as atherosclerosis, inflammatory bowel disease, retinopathy of prematurity (ROP), borderline personality disorder (BPD), asthma, Parkinson's disease, kidney damage, preeclampsia and many more 37, 38, 39, 40. Thus, it can be suggested that the Biofield Energy Treated novel test formulation showed a significant improved antioxidant profile, which suggested the use of test formulation against various autoimmune disorders, anti-inflammatory diseases, anti-aging, and many more.
Conclusions
On the basis of current experimental anti-oxidation study findings, it is concluded that the novel Biofield Energy based test formulation and Biofield Energy Treatment per se showed a significant antioxidant activity after administration of the Biofield Energy Treated formulation as compared with the untreated test formulation. Antioxidant parameters focused in this study was taken from colon tissue and results showed CAT activity was significantly increased by 95.4%, 72.3%, 47.6%, and 13.9% in the G5, G6, G8, and G9 groups, respectively as compared with the untreated test formulation (G4). In addition, colon GSH activity was found to be significantly increased by 23.2%, 15.4%, and 15.5%, in G5, G6, and G9 groups, respectively with respect to G2 group. Further, it was found that the level of LPO was reduced in test groups such as decreased activity by 12%, 17%, 18%, and 19.1% in the G5, G6, G7, and G8 groups respectively, as compared with the diseases control group. Similarly, MPO level was found comparative with the disease control and data showed a significant decreased level by 27.9%, 22%, 14.5%, 16.6%, and 25.3% in the G5, G6, G7, G8, and G9 groups, respectively as compared with the G2 group. SOD enzyme was increased by 16.7% and 14.2% in the G5 and G9 groups, respectively as compared with the untreated test formulation, G4 group. In similar manner, the colon GPx activity showed an increased trend by 177.6%, 71.4%, 71.4%, 161.2%, and 114.3% in the G5, G6, G7, G8, and G9 groups, respectively as compared with the G2 group. Thus, on the basis of experimental results of colon antioxidant activity, the novel test formulation after treated with the Trivedi Effect®- Biofield Energy Healing would be used against various autoimmune disorders, anti-inflammatory diseases, anti-aging, and many more. Oxidative damage and free radicals are related with a number of diseases such as atherosclerosis, Alzheimer's disease, cancer, ocular disease, diabetes, rheumatoid arthritis and motor neuron disease. The Biofield Energy Treated test formulation can be used as a Complementary and Alternative Medicine (CAM) to prevent the immune-mediated diseases such as Irritable Bowel Syndrome, Ulcerative colitis and Crohn's disease, Stress, Asthma, and many more with safe therapeutic index. Besides, it can also be utilized in organ transplants (for example kidney transplants, liver transplants and heart transplants), various autoimmune disorders such as Lupus, Addison Disease, Celiac Disease (gluten-sensitive enteropathy), Dermatomyositis, Graves’ Disease, Hashimoto Thyroiditis, Multiple Sclerosis, Myasthenia Gravis, Pernicious Anemia, Aplastic Anemia, Sjogren Syndrome, Systemic Lupus Erythematosus, Diabetes, Alopecia Areata, Fibromyalgia, Vitiligo, Psoriasis, Scleroderma, Chronic Fatigue Syndrome and Vasculitis, Type 1 to improve the overall health and quality of life.
Acknowledgements
The authors are grateful to Dabur Research Foundation, Trivedi Science, Trivedi Global, Inc., and Trivedi Master Wellness for their support throughout the work.
References
- 1.Dylag K, Hubalewska-Mazgaj M, Surmiak M, Szmyd J, Brzozowski T. (2014) Probiotics in the mechanism of protection against gut inflammation and therapy of gastrointestinal disorders. , Curr Pharm Des 20, 1149-1155.
- 2.Wang Y, Wu Y, Wang Y, Xu H, Mei X et al. (2017) Antioxidant properties of probiotic bacteria. , Nutrients 9(5), 521.
- 3.Poplawski T, Chojnacki C, Czubatka A, Klupinska G, Chojnacki J et al. (2013) pyloriinfection and antioxidants can modulate the genotoxic effects of heterocyclic amines in gastric mucosa cells. , Mol Biol Rep 40, 5205-5212.
- 4.Greenway F, Wang S, Heiman M. (2014) A novel cobiotic containing a prebiotic and an antioxidant augments the glucose control and gastrointestinal tolerability of metformin: A case report. , Benef Microbes 5, 29-32.
- 5.Serban D E. (2015) Microbiota in inflammatory bowel disease pathogenesis and therapy: Is it all about diet?. , Nutr Clin Pract 30, 760-779.
- 6.Carding S, Verbeke K, Vipond D T, Corfe B M, Owen L J. (2015) Dysbiosis of the gut microbiota in disease. , Microb Ecol Health Dis 26, 26191.
- 7.Thomas K J, Nicholl J P, Coleman P. (2001) Use and expenditure on complementary medicine in England: A population based survey. , Complement Ther Med 9, 2-11.
- 8.Manya K, Champion B, Dunning T. (2012) The use of complementary and alternative medicine among people living with diabetes in Sydney. , BMC Complement Altern Med 12, 2-10.
- 9.Astin J A, Pelletier K R, Marie A, Haskell W L. (2000) Complementary and alternative medicine use among elderly persons: One-year analysis of a blue shield medicare supplement. , J Gerontol A Biol Sci Med Sci 55, 4-9.
- 10.Movaffaghi Z, Farsi M. (2009) Biofield therapies: Biophysical basis and biological regulations?. , Complement Ther Clin Pr 15, 35-37.
- 11.Berman J D, Straus S E. (2004) Implementing a research agenda for complementary and alternative medicine. , Annu Rev Med 55, 239-254.
- 12.Frass M, Strassl R P, Friehs H, Mullner M, Kundi M et al. (2012) Use and acceptance of complementary and alternative medicine among the general population and medical personnel: A systematic review. , Ochsner J 12, 45-56.
- 13.Sancier K M, Holman D. (2004) Commentary: Multifaceted health benefits of medical qigong. , J Altern Comp Med10: 163-165.
- 14.Trivedi M K, TRR Mohan. (2016) Biofield energy signals, energy transmission and neutrinos. , American Journal of Modern Physics 5, 172-176.
- 15.Trivedi M K, Branton A, Trivedi D, Nayak G, Mondal S C et al. (2015) Antimicrobial sensitivity, biochemical characteristics and biotyping ofStaphylococcus saprophyticus: An impact of biofield energy treatment. , J Women’s Health Care 4, 271.
- 16.Trivedi M K, Patil S, Shettigar H, Mondal S C, Jana.S (2015)In vitroevaluation of biofield treatment onEnterobacter cloacae: Impact on antimicrobial susceptibility and biotype. , J Bacteriol Parasitol 6, 241.
- 17.Trivedi M K, Patil S, Shettigar H, Mondal S C, Jana S. (2015) Evaluation of biofield modality on viral load of Hepatitis B and C Viruses. , J Antivir Antiretrovir 7, 83-88.
- 18.Trivedi M K, Branton A, Trivedi D, Nayak G, Mondal S C et al. (2015) Evaluation of antibiogram, genotype and phylogenetic analysis of biofield treatedNocardiaotitidis. , Biol Syst Open Access 4, 143.
- 19.Trivedi M K, Branton A, Trivedi D, Nayak G, Charan S et al. (2015) Phenotyping and 16S rDNA analysis after biofield treatment onCitrobacterbraakii: A urinary pathogen. , J Clin Med Genom 3, 129.
- 20.Peoples J J, Trivedi M K, Branton A, Trivedi D, Nayak G et al. (2017) Skin rejuvenating effect of consciousness energy healing treatment based herbomineral formulation. , American Journal of Plant Biology 2, 77-87.
- 21.Smith D M, Trivedi M K, Branton A, Trivedi D, Nayak G et al. (2017) Skin protective activity of consciousness energy healing treatment based herbomineral formulation. , Journal of Food and Nutrition Sciences 5, 86-95.
- 22.Weekes B A, Trivedi M K, Branton A, Trivedi D, Nayak G et al. (2018) an alternative approach for the management of bone health: Role of biofield energy healing treated vitamin D3. , American Journal of Internal Medicine 6, 1-9.
- 23.Piedad R B, Trivedi M K, Branton A, Trivedi D, Nayak G et al. (2018) Exploring the effects of biofield energy treated vitamin D3 on bone health parameters in MG-63 cell line. , International Journal of Food Science and Biotechnology 3, 15-22.
- 24.Patric E, Trivedi M K, Branton A, Trivedi D, Nayak G et al. (2018) The influence of biofield energy treated vitamin D3 on bone health and its health consequences in MG-63 cell-line. , Advances in Bioscience and Bioengineering 6, 1-9.
- 25.Trivedi M K, Branton A, Trivedi D, Nayak G, Gangwar M et al. (2015) Analysis of genetic diversity using simple sequence repeat (SSR) markers and growth regulator response in biofield treated cotton (GossypiumhirsutumL.). , American Journal of Agriculture and Forestry 3, 216-221.
- 26.Trivedi M K, Branton A, Trivedi D, Nayak G, Gangwar M et al. (2015) Evaluation of vegetative growth parameters in biofield treated bottle gourd (Lagenaria siceraria) and okra (Abelmoschus esculentus). , International Journal of Nutrition and Food Sciences 4, 688-694.
- 27.Trivedi M K, Branton A, Trivedi D, Nayak G, Balmer A J et al. (2016) Evaluation of pro-inflammatory cytokines expression in mouse splenocytes after incubation with biofield treated herbomineral formulation: Effect of biofield energy healing treatment - The Trivedi Effect®. , American Journal of Biomedical and Life Sciences 4, 87-97.
- 28.Trivedi M K, Branton A, Trivedi D, Nayak G, Ellis M P et al. (2016) Evaluation of pro-inflammatory cytokines expression in mouse splenocytes after co-incubation with the biofield energy treated formulation: Impact of the Trivedi Effect®. , International Journal of Biomedical Science and Engineering 4, 40-49.
- 29.Trivedi M K, Patil S, Shettigar H, Bairwa K, Jana S. (2015) Spectroscopic characterization of biofield treated metronidazole and tinidazole. , Med Chem 5, 340-344.
- 30.Trivedi M K, Patil S, Shettigar H, Bairwa K, Jana S. (2015) Effect of biofield treatment on spectral properties of paracetamol and piroxicam. , Chem Sci J 6, 98.
- 31.Trivedi M K, Tallapragada R M, Branton A, Trivedi D, Nayak G et al. (2015) Evaluation of atomic, physical, and thermal properties of bismuth oxide powder: An impact of biofield energy treatment. , American Journal of Nano Research and Applications 3, 94-98.
- 32.Trivedi M K, Patil S, Nayak G, Jana S, Latiyal O. (2015) Influence of biofield treatment on physical, structural and spectral properties of boron nitride. , J Material Sci Eng 4, 181.
- 34.Loguercio C, M Di Pierro. (1999) The role of glutathione in the gastrointestinal tract: A review. , Ital J Gastroenterol Hepatol 31, 401-407.
- 35.Podrez E A, Abu-Soud H M, Hazen S L. (2008) Myeloperoxidase-generated oxidants and atherosclerosis. , Free Radic Biol Med 28, 1717-1725.
- 36.Banniste J, Bannister W, Rotilio G. (1987) Aspects of the structure, function, and applications of superoxide dismutase. , CRC Crit Rev Biochem22: 111-180.
- 37.Balmus I M, Ciobica A, Trifan A, Stanciu C. (2016) The implications of oxidative stress and antioxidant therapies in Inflammatory Bowel Disease: Clinical aspects and animal models. , Saudi J Gastroenterol 22, 3-17.
- 38.Vasilaki A T, McMillan D C. (2011) Lipid Peroxidation. In: Schwab M. (eds) Encyclopedia of Cancer. , Berlin, Heidelberg