
Climate Change Sustainable Net-Zero Emissions by Uptake Atmospheric Carbon Dioxide by Terrestrial and Aquatic Plants

Abstract
A sustainable global net-zero carbon emission is when emissions are equivalent to the uptake of carbon by global terrestrial and aquatic plants. To meet that objective, an approximate 50% reduction of fossil-fuel emissions was estimated for net-zero by 2050 using carbon dioxide concentrations and mass emission monitoring by NOAA and related references. From that data, the initial target level of reduction to obtain net-zero was selected for year 2000 to minimise effects of climate change on environmental damage. The recent finding that about half of global emissions are taken up from the atmosphere and increases global terrestrial and aquatic plant growth, including agriculture plants for food production, indicates it is important to maintain the year 2000 levels in the atmosphere. It was concluded as renewable energy was found to need support, it could be supplemented by electricity production remaining after obtaining net-zero, which also supports the atmospheric carbon dioxide levels for their important global ecological contribution.
Article Information
- Received
- Accepted
- Published
Academic Editor: Ricardo Gobato, Green Land Landscaping and Gardening, Seedling Growth Laboratory, 86130-000, Parana, Brazil
Checked for plagiarism: Yes
Review by: Single-blind
Copyright © 2026 Bruce R. Hodgson.
 This is an open-access article distributed under the terms of the Creative Commons Attribution License, which permits unrestricted use, distribution, and reproduction in any medium, provided the original author and source are credited.
Corresponding author: Bruce R. Hodgson, Faculty of Science and Engineering, Southern Cross University, Lismore, New South Wales, Australia —
Competing Interests
There are no known conflicts of interests.
Funding
No specific funding statement was provided by the authors.
Data Availability
The datasets used in this study are publicly available from NOAA, NASA, the Global Carbon Project, and the IEA.
Acknowledgements
No funding was received for conducting this part of the study, which developed from previous studies on ecosystem-based management with comments by an unknown independent reviewer.
Citation:
Introduction
The United Nations Climate Change (2023) report suggested carbon emissions needed to be reduced to obtain sustainable global net-zero carbon emissions by 2050. That was justified by Friedlingstein et al. (2024) who noted net carbon emissions are when the emissions are equivalent to global terrestrial and aquatic plant carbon uptake. They stated Fossil CO2 emissions accumulate in the atmospheric and CO2 concentration is measured directly. The global net uptake of CO2 by the ocean, called the ocean sink, is estimated by global ocean biogeochemistry models and observations and the global net uptake of CO2 by the land, called the land sink, is estimated with dynamic global vegetation models. Hence, they found 48% of the anthropogenic (human-led) accumulation of CO2 in the atmosphere is taken up by global land and ocean plants by natural plant uptake of their important carbon nutrient to maintain growth. Note that with reduced emissions their will be residual emissions to obtain net-zero emissions by 2050. Net-zero means CO2 emissions are reduced to the level where they are in equilibrium with the land and ocean sinks. Hence the carbon dioxide removal (CDR) from emissions is defined by the rate of emission deduction each year for 25 years. By that process, removal of CO2 from the atmosphere is reduced to the net-zero level. Therefore, Climate neutrality is defined by net-zero. It is also important to maintain atmospheric CO2 levels to support global plant uptake, so the initial reduction of emissions to the year 2000 level is an important benchmark.
The International Energy Agency (2021) lists the knowledge gaps that support global net-zero carbon emissions by 2050, including stable and affordable energy supplies with use of renewable solar and wind to replace fossil fuels. Hence, the aim of this paper is to estimate the reduction in carbon emissions needed to obtain sustainable global net-zero carbon emissions by 2050. The research undertaken to support that aim includes previously known information and the ecologically important recent finding by 1 of atmospheric carbon dioxide uptake by global plants equivalent to about 48% per year of emissions. Note that carbon emissions are only about 27.3% of CO2 emissions due to the ratio of carbon atomic weight 12 compared with 44 for CO2 (27.3% = 100 x 12/(44 from {C 12 + oxygen 16x2 = 32})). However, the literature indicates the amount of carbon emissions needed to obtain net emissions is currently debated in various countries Azevedo et al. (2021), Shahzad et al. (2024) and uncertain Bastos et al. (2020), Heinze et al. (2015), Casas-Ruiz et al. (2023). Further confusion was introduced by the literature suggesting reducing emissions to the recognized beginning of industrialisation in 1960. Unfortunately, that was without considering reduction of carbon in the atmosphere lower than the 1960 baseline is not acceptable because carbon is an essential nutrient to maintain terrestrial plant growth and food crops for the human population 2, which is upheld by the more recent findings in Lombardozzi et al. (2025). Furthermore, carbon in the atmosphere maintains aquatic plant ecosystems 3, 4. Due to the importance of atmospheric CO2 in increasing global plant production, it is important not to reduce emissions to a level that compromises global plant production. Based on that finding, the overall purpose of this paper is to reduce the amount of carbon emissions to give global net-zero carbon emissions that are sustainable by maintaining a level of emissions to the atmosphere that are equivalent to the global terrestrial and aquatic plant uptake.
The novelty and originality of this study is due to the need to take into account the previously unknown finding by new research that an estimated 48% of atmospheric carbon dioxide is taken up by global terrestrial and aquatic plants 1. In addition, the uptake increases global plant growth and almost certainly food crop growth and production 5. That means the approach to mitigating climate change effects is completely new, and needs to advance the state of climate change research using the following objectives: (i) carbon dioxide emissions deduced to a level that maintains atmospheric carbon dioxide levels that supports global plant growth and minimises damage by climate change processes. As the broader climatic impacts of continued fossil-fuel emissions must be considered, the initial target level of reduction to obtain net-zero was selected for the year 2000 to minimise effects of climate change on environmental damage, (ii) develop renewable energy systems that can replace the reduction in fossil-fuel electricity production and (iii) create super-efficient low carbon dioxide emission fossil-fuel electricity plants to support renewable energy systems and maintain an acceptable level of atmospheric carbon dioxide.
To estimate global net-zero carbon emissions, the reported data from the NASA’s Global Monitoring site in Lindsey, (2025) with related references was used. The NOAA Mauna Loa Observatory (MLO), located on the north flank of the Mauna Loa volcano in Hawaii, is a premier, state-of-the-art atmospheric baseline research facility. It is widely considered the world's benchmark for monitoring climate change and anthropogenic carbon dioxide (CO2). See the Global Monitoring Laboratory U.S. Department of Commerce National Oceanic & Atmospheric Administration NOAA Research. https://gml.noaa.gov/obop/mlo/#:~:[email protected]., Mauna%20Loa%20Baseline%20Observatory,with%20offices%20in%20Hilo%2C%20Hawaii. (also see the online https://gml.noaa.gov/ccgg/trends/). They reported that the atmospheric accumulation of carbon dioxide, CO2, was about half that expected by the measured CO2 emissions, which was upheld by a major study of Friedlingstein et al. (2024) who estimated about 48% of the emitted amounts were taken up by global terrestrial and aquatic plants, including freshwaters, estuaries, coastal sea plants and the ocean. Note that the 48% removal is based upon the lower than expected CO2 atmospheric concentrations in ppm compared with the annual mass CO2 emissions in Bt/year. They estimated terrestrial CO2 uptake was about 30% of global emissions and aquatic plants 26% (total 56%), so the overall 48% removal from the atmosphere indicates about 8% was emitted back to the atmosphere by various processes. Also, it is likely the terrestrial uptake includes an unknown, but actually important, increased agriculture production. In that regard, the recent study by Ainsworth et al., (2025) suggested the increase in atmospheric CO2 may have increased crop production. Though, it is expected increased nutrients and water may need to be applied to maintain the crop increased production. Importantly, Hannah and Roser (2019) estimated 36.88% of the world total land area was used for agriculture in 2022 (updated from 2019 to 2022 by the online “Our World in Data” website https://ourworldindata.org/land-use ), while Sha et al., (2022) suggests the global carbon sink could be increased by improving land management practices.
Therefore, to minimise complexity, the approach used here is to estimate the global net-zero carbon emissions using the measured increase in atmospheric carbon dioxide mass emissions by NASA to 2024 in Lindsey (2025). However, the emission data in some of the later years leading up to 2024 did not follow the atmospheric increase in CO2 concentrations, as it did from around 1970, so the emissions were tested using online data sources, such as the International Energy Agency, published by IEA for the Organisation for Economic Co-operation and Development (OECD), Paris, France https://www.iea.org/ , as well as from the major research by Friedlingstein et al. (2024).
Obtaining sustainable net-zero carbon by 2050 is the stated aim by the International Energy Agency, see Bouckaert et al. (2021), and it is essential that industry is not delayed due to difficulties in implementing net-zero before 2050. Therefore, alternative target levels of reduction are suggested that optimises plant production and also provides net carbon emissions. Three levels of net-zero are suggested: reduce emissions to (i) in 1969 CO2 emissions first became related to atmospheric concentrations at about 16Bt/year (see second figure in NASA Goddard Institute for Space Studies 6. (ii) at average CO2 emissions about 21Bt/year, the average global surface air temperatures had a moderate increase of 0.5oC between 1979 and 1985 (see NASA Goddard Institute for Space Studies, 2025 Surface Temperature Analysis https://data.giss.nasa.gov/gistemp/) (iii) the global costs of extreme weather became significant from 2000-03 (see Newman and Noy, 2023) with CO2 emissions about 31Bt/year and average air temperature increase of about 0.75oC. The emission targets with average air temperature increases of 0.5oC and 0.75oC may provide a buffer with the preferred Paris Agreement 1.5oC limit 1. Hence, the year 2000 target for carbon emission reduction was selected on the basis that the insurance industry found significant climate change environmental effects did not occur until 2000. That initial target is considered acceptable because the IPCC Climate Change 2001: Synthesis Report for 2000 noted the average atmospheric carbon dioxide had increased from 280 ppm for the period 1000-1750 to 368 ppm in year 2000. The also expected atmospheric CO2 concentrations to be 405–460 ppm in 2025, which is in the correct range, and projected an increase to 490 to 1,250 ppm to by 2100, causing significant environmental changes. Therefore, by assuming the trends from 1969 to 2025 of atmospheric CO2 concentrations and emissions continued, the concentrations and emissions were extended to 2050. That assumption is based upon the global trend for increased emissions from 1969 to 2025, which were essentially unchanged, suggesting attempts at reducing global emissions by installing mostly wind and solar systems in the developed counties had not significantly reduced emissions. By comparison, carbon dioxide emissions by developing countries were only about 5.5% of the global emissions by the ten top fossil-fuel electricity generators. Furthermore, it is likely to be difficult to convince the main electricity generators to reduce fossil-fuel combustion due to its cost competitive advantage with intermittent renewable energy 7. Hence, as the trend for increasing CO2 concentrations and emissions from 1969 to 2025 was confirmed as reliable, the approach to estimating net carbon emissions using projected carbon emissions to 2050 is described in the Methods and outcomes presented in the Results Section, with the implications considered in the Discussion Section.
Methods
The background information for this study was collected from published papers, reports and reliable online documents. The data are from Lindsey (2025, see their two figures) and 2024 and 2025 emission values from Friedlingstein et al. (2024) projected to 2025. The 2024 emission was estimated from their 2023 value of 40.6 Bt/year by adding an estimated 0.25 Bt/year, giving 40.85 Bt/year in 2024. All the CO2 data for ten year periods was estimated from Lindsey (2025) graph of continuous data records, beginning in 1958-1960 to 2000-2024. In addition, other than emission data for 2024 and 2025, all the CO2 emissions were estimated from Lindsey (2025). Note: the CO2 concentration and mass emission in 1969 was included in the trends because at that year the increase in emissions became related to the increase in CO2 concentrations.
Statistical analyses: Trends for the atmospheric carbon dioxide concentrations and CO2 emissions were obtained by Microsoft Excel regression using a curvilinear polynomial function. The Excel regression in Figure 1 was based upon R2 = 0.9914, with n = 9, so statistically highly significant p <0.001. As concentrations and mass emissions followed an existing curvilinear trend to 2025, the values after 2025 were assumed to following the existing trend for increase for consistency with the IPCC projections without significant emissions reduction. The trend was extended from 2025 to 2050 using the Microsoft Excel forecast periods for the existing trend line. The projection to 2050 with the nine 10 year observations from the NOAA Mauna Loa Observatory is not an unrealistic assumption because Figure 1 b shows Global carbon dioxide emissions increase by 51.0% in 2050 (100x(62.8-41.6)/41.6), similar to the UN Planet-warming greenhouse gas emissions expected to rise to nearly 50 per cent from today. https://www.unep.org/news-and-stories/story/without-big-changes-what-environment-will-look-050#:~:text=Planet%2Dwarming%20greenhouse%20gas%20emissions, 9.2%20billion%20people%20%E2%80%93%20by%202050. In addition, the projection to 2050 was maintained by the linear equation for the relationship between CO2 concentrations and CO2 emissions in Figure 2, assessed as acceptable by goodness of fit statistics using R2 = 0.9787 with P-value < 0.05 for the 9 observations, including the 3 projected values from 2030 to 2050.
The net-zero carbon emission was estimated here from 2050 down to the three target levels of reduction by converting CO2 to carbon for the initial emission in 1969, then for a 0.5oC air temperature rise in 1979 to 1985 and beginning of significant weather events in 2000. The net-zero global carbon plant uptakes were estimated by multiplying the literature 48% emission uptake by global plants for each level of reduction from 2050. As the carbon emission increase over time is shown in Lindsey (2025), the time taken to reach each proposed alternative level of net emissions was estimated. Due to the relatively short time from 2025 to 2050, it is suggested the level (iii) reduction to 2000 to minimise effects of extreme weather events be the first target.
Results
To allow estimation of the net carbon emissions, the findings are presented in the following order: (1) Graphs of the curvilinear increasing trends in atmospheric carbon dioxide and carbon concentrations to show the consistent trend from 1958 to 2025, with the trends projected to 2050, see Figure 1 (a). (2) Graphs of the curvilinear atmospheric increasing trends in carbon dioxide emissions and carbon emissions in Figure 1 (b), for the trend from 1969 to 2025 and projected to 2050. (3) Graph of the linear relationship of atmospheric carbon concentrations with carbon emission rates in Figure 2. (4) Table 1 for the top ten countries for coal consumption, electricity production and carbon dioxide emissions. (5) estimated global net-zero carbon emissions.
Trends in atmospheric carbon dioxide, carbon concentrations and emissions projected to 2050
Graphs of the 2nd Order curvilinear increasing trends in atmospheric carbon dioxide, carbon concentrations and related emissions show a consistent increasing trend from 1958 to 2025, with the trends projected to 2050 shown in Figure 1.
Figure 1. Redrawn from Lindsey (2025) with Friedlingstein et al. (2024) carbon dioxide emission values converted to carbon emissions in 2025 and estimated for 2024. (a) Trends in atmospheric CO2 concentrations (LHS blue diamonds) and carbon concentrations (RHS red squares) from 1958 to 2025 with projected levels to 2050 (open diamonds) and open red squares. (b) Trends in global emissions from 1969 to 2025 and projected to 2050 for CO2 emission rates (LHS solid blue and open diamonds) and carbon emission rates (RHS solid and open red squares). 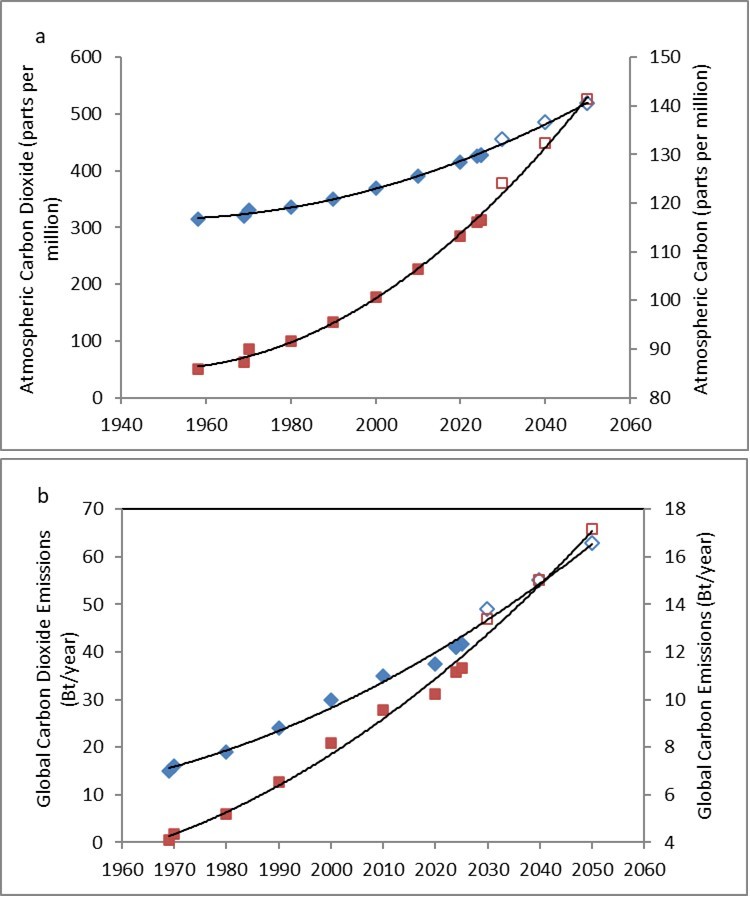
Download figure
Relationship of atmospheric carbon concentrations with carbon emission rates
The relationship in Figure 2 was:
Figure 2. Relationship of Atmospheric carbon concentrations with global carbon emission rates. Data used is from 1969 to 2025 in Lindsey (2025) with 2023 and 2024 from Friedlingstein et al. (2024) with carbon dioxide concentrations converted to carbon emissions rates with ± one standard deviation, σ. 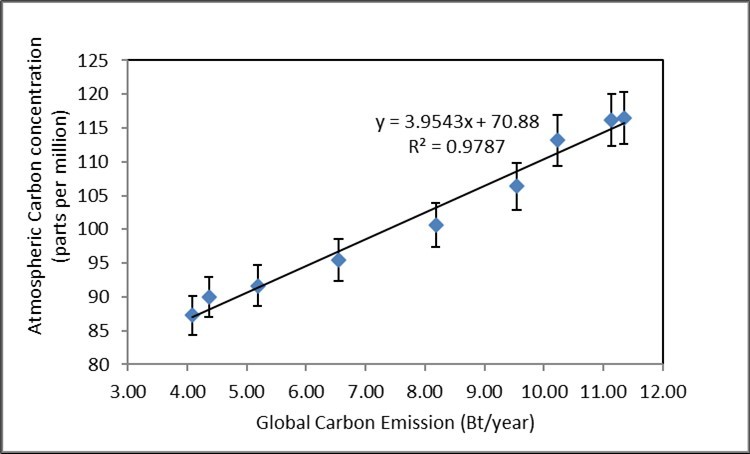
Download figure
Atmospheric Carbon Concentration (ppm) = 3.9543 x Carbon Emission (Bt/year) + 70.88,
with R² = 0.9787, n = 9, p < 0.001.
The highly significant relationship confirms the importance of maintaining atmospheric emissions to support global production of terrestrial and aquatic plants for sustainable net-zero emissions. It also indicates that wind and solar electricity production have not had a significant effect on the continuing trend in CO2 emissions. Therefore, the trends for increase to 2025 in Figure 1 are confirmed as representative, and were projected to 2050 on the assumption that there is likely to be a similar rate of increase in electricity demand. On that basis, the coal consumption, electricity production and countries ranked by CO2 emissions for the world’s top ten countries is shown in Table 1. Note: Vietnam is included in Table 1 due to its rapid economic development and resulting significant emissions. The annual total CO2 emissions up to January 2026 were 20,615 Mt/year while the literature showed the remaining countries in the world only emitted 1,139 Mt/year, about 5.5% of that by the top ten countries. The means nearly all the carbon emissions need to be managed by the top ten emitting countries to achieve a global net-zero carbon emissions, which are investigated in the next Section.
Interestingly, the total carbon dioxide emission in Table 1 about 20.6 Bt is about 50% of the estimated global CO2 emissions of 41.6 Bt/year in 2025 in Figure 1 (b), 49.5% = (100 x 20.6/41.6). That is similar to the 48% of CO2 emissions expected to be removed by the global plant uptake, indicating the online Coal Global Coal Plant Tracker https://globalenergymonitor.org/projects/global-coal-plant-tracker/ had removed the expected global plant uptake from the reported CO2 emissions. That was confirmed by dividing the total emissions of 20.6 Bt/year by the 48% removal, giving 42.9 Bt/year (42.9 = 20.6/0.48), which is similar to the 41.6 Bt/year CO2 emissions independently reported by Friedlingstein et al. (2024), projected to 2025. As CO2 emissions from developing countries are minor compared with those of the developed countries, the global net-zero carbon emissions are estimated below using the reported 48% of uptake by terrestrial and aquatic plants.
Table 1. Top ten countries for coal consumption (Mt/y), electricity production (megawatts, MW) and measured carbon dioxide emissions (Mt/y).| Country | Coal Consumption (Mt/y) | Electricity Production (MW) | Carbon Dioxide Emission (Mt/y) |
| China | 4,319,922 | 1,239,022 | 12,667 |
| United States a | 1,724,082 | 487,216 | 4854 |
| India | 966,289 | 249,873 | 1535 |
| Indonesia | 102,624 | 60,705 | 340 |
| Japan | 210,560 | 53,000 | 320 |
| Russia | 230,298 | 37,193 | 270 |
| S. Africa | 202,298 | 45,024 | 207 |
| S. Korea | 157,124 | 41,745 | 177 |
| Vietnam | 56,641 | 27,719 | 147 |
| Germany | 257,489 | 28,323 | 98 |
| Total b | - | - | 20,615 |
Estimated Global Net-zero Carbon Emissions
In terms of climate change effects on the Antarctic, Hodgson (2025) noted from the literature that global net-zero carbon emissions were equivalent to the amount of removal by land and aquatic environments from carbon emissions to the atmosphere. Carbon is used to estimate global net-zero carbon emissions because carbon is used by terrestrial and aquatic plants for growth by photosynthesis using some of the carbon in CO2 from the atmosphere. They take up carbon dioxide directly in the air or indirectly dissolved in fresh and salt water, for growth and release the oxygen as a waste product. It was also suggested that if global net-zero carbon emissions were not implemented by 2050, significant ecological changes in the Antarctic could occur. In that regard, obtaining net-zero carbon emissions by 2050 was estimated by Friedlingstein et al. (2024) by reducing emissions by an average of about 0.44 BtC per year (1.6 BtCO2 x 12/44) each year. By comparison, net carbon emissions are estimated from Figure 1 (b), which shows projected carbon emissions in 2050 about 17.1 Bt/year. As the global uptake of carbon emissions is 48%, applied to the 17.1 Bt/year, less the 2000 target level of 8.2 Bt/year, gives an estimated net carbon emission reduction of 8.9BtC/year. As there are 25 years from the current emission level in 2025 to 2050, the rate of decrease for the next 25 years is 0.356 BtC/year (0.48 x (17.1 - 8.2 = 8.9)/25), similar to the 0.44 BtC per year by 1. That gives an estimated average rate of emission reduction about 2.1%/year (100 x 0.356/17.1). The moderate reduction of 0.356 BtC/year is considered acceptable to the reach the goal of 8.2 BtC/year for the year 2000 target level. In that regard, Friedlingstein et al. (2024) estimated coal combustion contributes about 41% of global fossil CO2 emissions in 2023, Oil about 32% and gas about 21%. Although most carbon emissions are from coal fired power plants, the online International Energy Agency, IEA, World Energy Outlook, 2023 predicted a 60% reduction in coal combustion by 2050 (see their online website https://www.iea.org/reports/world-energy-outlook-2023), which is similar to the 52% reduction in carbon emissions estimated here for net-zero emissions (52.0% = 100 x 8.9/17.1).
In order to achieve the estimated net-zero carbon emissions, it is suggested the 2.1%/year reduction is applied to the top ten countries in Table 1 in proportion to their measured carbon dioxide emissions, Kindly note: the same proportion is obtained when CO2 is converted to carbon. As it is envisaged to take the time to 2050 to meet net carbon emissions, the 2.1%/year applies to the variation in carbon dioxide emissions each year for 25 years by the ten countries, above or below the projected CO2 emissions in Figure 1 (b).
Discussion
The above estimate of a 52% reduction in current carbon emissions by the top ten countries to obtain net-zero, indicates about 48% (100% - 52%) of unused emissions are still generated by fossil-fuel electricity production. Some of that production could be used to supplement renewable energy, and the remaining carbon emissions used to maintain atmospheric input to the global terrestrial and aquatic plants, including agricultural food production for an increasing world population. Likewise, the increased production of global terrestrial plants is likely helping global attempts to increase wildlife numbers due to the increased plant growth and associated native food production on land occupied by wildlife, outside agricultural land and human population areas.
As the maintenance of electricity production for upkeep of global plant production was an unexpected outcome of the 48% of atmospheric emissions used by global plants, it is also important to construct new fossil-fuel electricity production plants that are super-efficient with low carbon dioxide emissions to replace the current, aged inefficient plants, while remaining within the above electricity production carbon emission limit. The amount of new electricity production may depend on a balance between the costs of renewables compared with that of the unused climate change fossil-fuel combustion to support renewables and sustainable global net-zero carbon emissions. The suggested renewable energy fossil-fuel support is based upon the estimated carbon emission reduction to the 2000 level in 25 years of about 52% of electricity production not created by fossil-fuels to be replaced by renewable energy. The recent literature suggests the intermittent renewable energy may not be able to cope with such an increase in electricity production. Hence, it is suggested that strategy is consistent with the need to sustainably maintain the 48% of carbon emissions taken up from the atmosphere by the global terrestrial and aquatic plants.
In relation to mitigation of climate change, all the countries in Table 1 made commitments to obtain net-zero emissions by 2050 under the UN Framework Convention on Climate Change (UNFCCC), including India but not until 2070, and except China’s 2060 proposal for the Paris Agreement of limiting average air temperature increase to 1.5oC (see online Climate Action Tracker https://climateactiontracker.org/ for China). In addition, they all included starting reductions at various times before 2030/35, but the above trends for increases indicate inadequate effects. However, the U.S. Department of Energy has reduced CO2 emissions from electricity production from the high in 2007 by 41% in 2023 as shown in United States Environmental Protection Agency (2025) for their inventory of U.S. Greenhouse Gas Emissions and Sinks: 1990-2023. The United States has the aim to address climate change by committing to 50 to 52% reduction from 2005 levels in greenhouse gas pollution by 2030, and achieving net-zero emissions by 2050.
In terms of reducing emissions by renewable energy systems, the online International Energy Agency, Renewable Energy Progress Tracker https://www.iea.org/data-and-statistics/data-tools/renewable-energy-progress-tracker predicts, even with policy changes, that the level of emission reduction could be met or exceeded by increasing global wind and solar electricity production. On the other hand, the literature in 2025/2026 indicates that while wind and solar energy are increasing, they are not currently sufficient to reduce carbon emissions due to rising energy demand, renewable infrastructure limitations, and the basis of fossil fuels in the global energy supply. That was proposed by Biserčić and Bugarić (2021) who concluded the intermittent renewable electricity production could best be supplemented by natural gas electricity production. However, with the usual practice of on-site storage of coal supplies, they noted coal-fired generation is more reliable than renewables, even with a gas electricity production baseload to support renewables. Renewable energy also has intermittent generation and associated costs with its management 8, and reliance on a fossil fuel baseload when not producing sufficient, or any, electricity. The costs of renewable energy management are reported as due to the high cost of constructing and maintenance of power lines from many, small dispersed renewable electricity sites to the main transmission grid (see online United States Department of Energy, 2023 https://www.energy.gov/) as well as the study on “Tackling High Costs and Long Delays for Clean Energy Interconnection” by the online International Energy Agency, 2025. They report that grid congestion is posing challenges for energy security and renewable energy transitions, IEA, Paris https://www.iea.org/commentaries/grid-congestion-is-posing-challenges-for-energy-security-and-transitions. In addition, the increased costs of constructing and maintaining renewable energy systems are passed on from electricity providers to the consumers. Therefore, the online information suggests interconnection is likely to remain a major obstacle for renewable systems to meeting clean energy production and net-zero carbon emission goals, so this matter requires further investigation.
Those findings also suggest making it difficult to convince the electricity producers to change from coal and gas to renewable systems. Consequently, to meet the estimated average net emission reduction of 0.356 BtC/year every year for the next 25 years, the following approach is considered. There are potential benefits for the top ten carbon dioxide emitting countries by reducing carbon emissions to the level that provides a feedback in the balance between zero-cost of the 48% of atmospheric removals balancing the cost amount to the electricity industry reducing CO2 emissions. As well, the U.S. Department of Energy (2022) shows that High-Voltage Direct Current (HVDC) technology provides highly efficient ways to receive, transmit, and deliver large amounts of renewable energy over long distances from across America from wind and solar system areas. The areas selected were based on deserts for high solar radiation and windy areas away from Hurricane and tornado areas. However, due to the high cost of installing and maintaining HVDC transmission lines over such long distances, it is likely to be used in the developed countries to improve the cost-efficiency of renewable electricity, as it is in Europe, and for HVDC electricity connection between Canada and United States 9.
Hence, with further investigations, it may be possible to maintain solar electricity production in Europe from the desert in North Africa using a HVDC connection from Morocco to Spain across the Strait of Gibraltar to Spain, France and the United Kingdom. An additional HVDC connection from Egypt could be investigated to aid renewable energy in Eastern Europe via the Levant and Turkey. South Africa has northern arid areas, so they may be able to have solar HVDC electricity transmission connection to the very dry areas while avoiding animal migration areas. With some financial support, it may be possible to have solar energy in the developing countries shown in Table 1 of India, Indonesia, South Korea and Vietnam by HVDC to desert areas, provided the HVDC electricity can reach that far. For example, the countries of India, Indonesia and Vietnam could have solar electricity production in the south eastern Tibetan Plateau desert, and with South Korea to the eastern Tibetan Plateau. Therefore, those and the above scenarios for reducing carbon emissions are suggested as reasonable by considering the situation as a whole. That includes allowing for the current increased costs to the insurance industry since 2000 by damage caused by climate change, potentially including the infrastructure for electricity production by both fossil-fuel and renewable systems, including the large areas of solar panels 10, in developed and developing countries.
Conclusions
To achieve sustainable global net-zero carbon emissions in about 25 years from the estimated 2050 emissions, down to the suggested 2000 target level requires about half the current carbon emissions to be reduced. The other half is suggested to be used to maintain renewable energy and atmospheric carbon dioxide concentrations for growth of terrestrial and aquatic plants. It is also suggested further research for solar electricity production by HVDC transmission connections to desert areas. The suggested strategy of carbon emission reduction of 0.356 BtC/year every year for the next 25 years is expected to require approval of the United Nations climate change controlling system under the Framework Convention on Climate Change, as well as the various stakeholders for the final carbon emission decision. However, without the suggested carbon emission reduction rate beginning soon, it is likely global climate change effects may continue to increase and add to the already obvious environmental effects.
References
- 1.Friedlingstein P, O'sullivan M, M W Jones, R M Andrew, Hauck J et al. (2024) . Global carbon budget 2024. Earth System Science Data Discussions 1-133.
- 2.Ueyama M, Ichii K, Kobayashi H, T O Kumagai, Beringer J et al. (2020) Inferring CO2fertilization effect based on global monitoring land-atmosphere exchange with a theoretical model. Environmental Research Letters 15(8), 084009-10.
- 3.Prentice I C, Farquhar G D, Fasham MJR, Goulden M L, Heimann M et al. (2001) Chapter 3, The carbon cycle and atmospheric carbon dioxide. In.
- 4.J A Raven, Giordano M, Beardall J, S C Maberly. (2011) Algal and aquatic plant carbon concentrating mechanisms in relation to environmental change. Photosynth. Res 109, 281-296.
- 5.E A Ainsworth, Sanz-Saez A, C P Leisner. (2025) Crops and rising atmospheric CO2: friends or foes?. Philosophical Transactions of the Royal Society B: Biological Sciences, B 380, 20240230-10.
- 6.Lindsey R. (2025) Climate change: atmospheric carbon dioxide. Scripps Institution of Oceanography, NOAA Global Monitoring Laboratory
- 7.A Z Biserčić, U S Bugarić. (2021) Reliability of baseload electricity generation from fossil and renewable energy sources. Energy and Power Engineering 13(05), 190-206.
- 8.Notton G, M L Nivet, Voyant C, Paoli C, Darras C et al. (2018) Intermittent and stochastic character of renewable energy sources: Consequences, cost of intermittence and benefit of forecasting. Renewable and sustainable energy reviews. 87, 96-105.
- 9.Pavlovski A. (2025) Towards Canada’s Transcontinental Supergrid: AC/DC Transmission Merge Solutions. Global Journal of Researches in Engineering: F Electrical and Electronics Engineering 25(1), 2025-72.
- 10.Rahman T, A, Lipu Hossain, M S Rahman, M S Ashique et al. (2023) Investigation of Degradation of Solar Photovoltaics: A Review of Aging Factors, Impacts, and Future Directions toward Sustainable Energy Management. Energies 16, 3706-10.
- 11.Azevedo I, Bataille C, Bistline J, Clarke L, Davis S. (2021) Net-zero emissions energy systems: What we know and do not know. Energy and Climate Change 2, 100049-10.
- 12.A Á Ballantyne, C Á Alden, J Á Miller, P Á Tans, White J W C. (2012) Increase in observed net carbon dioxide uptake by land and oceans during the past 50 years. Nature 488(7409), 70-72.
- 13.Bastos A, O'Sullivan M, Ciais P, Makowski D, Sitch S et al. (2020) Sources of uncertainty in regional and global terrestrial CO2 exchange estimates. Glob. Biogeochem. Cycles 34, 1-21.
- 14.Bouckaert S, A F Pales, McGlade C, Remme U, Wanner B et al. (2021) International Energy Agency (IEA), Net-zero by 2050, A Roadmap for the Global Energy Sector, Special Report. , Paris: IEA Publications
- 15.J P Casas-Ruiz, Bodmer P, K A Bona, Butman D, Couturier M et al. (2023) Integrating terrestrial and aquatic ecosystems to constrain estimates of land-atmosphere carbon exchange. Nature Communications 14(1), 1571-41467.
- 16.Chmielewska-Śmietanko D, Smoliński T, Bartela Ł, A G Chmielewski. (2025) . Prospects and Trends in the Development of Small Modular Nuclear Reactors. Energies 18(22), 5970-10.
- 17.Hannah R, Roser M. (2019) updated to 2022 by “Our World in Data”. Land Use: How is humanity using the Earth’s land? And how can we decrease our land use so that more land is left for wildlife? Published online at onlinehttps://ourworldindata.org/land-useData source: Food and Agriculture Organization of the United Nations (FAO), via World Bank.
- 18.Heinze C, Meyer S, Goris N, Anderson L, Steinfeldt R et al. (2015) The ocean carbon sink–impacts, vulnerabilities and challenges. Earth System Dynamics 6(1), 327-358.
- 19.B R Hodgson. (2025) Ecosystem-Based Fishery Management of Antarctic Krill (Euphausia superba) to Support Baleen Whales and other Predators Production Adapted for Potential Climate Change Effects. Journal of Plant and Animal Ecology - 2(1), 51-61.
- 20.D P Keller, Lenton A, E W Littleton, Oschlies A, Scott V et al. (2018) The effects of carbon dioxide removal on the carbon cycle. Current climate change reports. 4(3), 250-265.
- 21.D L Lombardozzi, W R, Keppel-Aleks G, Lai J, Luo Z et al. (2025) Agricultural fertilization significantly enhances amplitude of land-atmosphere CO2exchange. Nature Communications 16(1), 1742-10.
- 22.Newman R, Noy I. (2023) The global costs of extreme weather that are attributable to climate change. Nature communications 14(1), 6103-10.
- 23.S M Ridge, G A McKinley. (2021) Ocean carbon uptake under aggressive emission mitigation. Biogeosciences 18, 2711-2725.
- 24.Sha Z, Bai Y, Li R, Lan H, Zhang X et al. (2022) The global carbon sink potential of terrestrial vegetation can be increased substantially by optimal land management. Communications Earth & Environment 3(1), 8-10.
- 25.Shahzad S, Faheem M, H A Muqeet, Waseem M. (2024) Charting the UK's path to net-zero emissions by 2050: Challenges, strategies, and future directions. IET Smart Grid 7, 716-736.
- 26.United Nations Climate Change (2023) Technical dialogue of the first global stocktake. Synthesis report by the co-facilitators on the technical dialogue. UN Climate Change Conference - United Arab Emirates Nov/Dec 2023 Fifty-ninth session, Author: UNFCCC, Framework Convention on Climate Change, by Director General, 8thSeptember 46, 631600.