
The Role of Health on Economic Development.
Abstract
In this project the main aim is to investigate the role of health on economic development. In doing so my inspiration was derive for the augmented neoclassical theoretical firm work base on the hypothesis that health has a positive impact on economic growth, looking at specification 1 and 4 are basic linear regression model which are used to capture the liner relationship between health and economic development. And looking at the graphs from our “appendix” we will observe a strong positive correlation between the variables. We also used life expectancy as a proxy for health which was positive and significant across all specification, which affirms that’s health have a positive and significant impact on economic growth as well as output per capita. For specification 3 and 6, we ran a “flexmix” which gives a reflection of a conclusion that our data most not be “cluster”, this is also supported by the pair wise plot which actually shows no meaningful cluster at a visual inspection.
Article Information
- Received
- Accepted
- Published
Academic Editor: Sasho Stoleski, Institute of Occupational Health of R. Macedonia, WHO CC and Ga2len CC, Macedonia.
Checked for plagiarism: Yes
Review by: Single-blind
Copyright © 2020 Jallow Assan
 This is an open-access article distributed under the terms of the Creative Commons Attribution License, which permits unrestricted use, distribution, and reproduction in any medium, provided the original author and source are credited.
Corresponding author: Correspondence: Jallow Assan, PhD student, Rome School of Economics, Italy —
Competing Interests
The authors have declared that no competing interests exist.
Funding
No specific funding statement was provided by the authors.
Data Availability
No data-availability statement was provided by the authors.
Citation:
Introduction
It is beyond all shadows of doubts that health is one of the paramount factors dictating the functioning of any economy. It is true that the more healthy laborers are physically and mentally are more efficient and robust meaning suffering less debility and disability. In such a case there will be less chances of absenteeism from work due to poor health condition either directly or indirectly. It is obvious that poor health condition diminishes hourly wages substantially. Health, in the form of life expectancy, has been shown in many cross-country growth regressions, and researches generally find that it has a significant positive effect on the rate of economic growth. However, these regressions do not sufficiently point out whether health directly benefits growth or whether it is merely a proxy for other absent or miss measured factor. There are quite influential body of microeconomic facts that preserves many of these impacts. The findings of historical findings suggest a very strong relationship between health and economic growth. It finds that between one third and one half of England’s economic growth in the past 200 years is due to improvements in the population’s food consumption. The existence of an impact of health on economic growth with similar magnitudes has been verified for different time dimensions and countries, which include Latin America and Mexico, as described as, Cross-country macroeconomic studies suggest that health positively affects growth. For example, an increase in life expectancy from 50 to 70 years, a 40% increase would raise the growth rate by 1.4 percentage points per year. A 10% decrease in malaria is associated with an increased annual growth of 0.3% 2. In the same vain malnutrition causes a decrease in the annual GDP per capita growth worldwide of between 0.23 and 4.7% For Latin America and the Caribbean, health, measured as the probability of surviving to the next age group, has a strong long-term relationship with growth also Using life expectancy and mortality rates as health indicators for different age groups, an estimate of the direct relationship between health and growth in Mexico from 1970-1995 indicates that health is responsible for approximately one third of long-term economic growth. Looking at studies on nutrition and that childhood health in general are important determinants of academic achievement. It shows (using the innovative instrument for life expectancy of predicted mortality based on cause of death data) that between 1940 and 1980 improvements in life expectancy did not contribute to the increase in GDP per capita growth across this same period.
The analysis of the impact of health improvements on economic growth has been well examined since Kelley (1988) found result that population had not impact on economic growth. This led to a flurry of research looking at demographic variables and their effect on economic growth (for example Bloom et al., 2004; Webber, 2002). The results have been mixed. But all studies focus on the single line equation of the direct effect of health on economic growth. In this project the main aim is to investigate the role of health on economic development. In doing so my inspiration was derive for the augmented neoclassical theoretical firm work base on the hypothesis that health has a positive impact on economic growth, looking at specification 1 and 4 are basic linear regression model which are used to capture the liner relationship between health and economic development. And looking at the graphs from our “appendix” we will observe a strong positive correlation between the variables. We also used life expectancy as a proxy for health which was positive and significant across all specification, which affirms that’s health have a positive and significant impact on economic growth as well as output per capita. For specification 3 and 6, we ran a “flexmix” which gives a reflection of a conclusion that our data most not be “cluster”, this is also supported by the pair wise plot which actually shows no meaningful cluster at a visual inspection.
Literature Review
The impact of health on development is actually split in to two dimension which are on the domain of theoretical and empirical studies. In the empirical literature 1, 3, 10 focus on the labor productivity effects of health on economic growth where improvements in health lead to an increase in per capita income directly as each individual is able to produce more per unit of labor input. The theoretical models, however, explore the relationship between health and economic growth via an indirect incentive impact on education investment 8, 9 are among the first to attempt to bridge the gap of the theoretical and empirical work in a cross country empirical study. Bloom et al. (2004) provide a summary of findings of various researchs that use life expectancy as a proxy for health in the analysis of the direct impact of health on economic growth. Transversely the researchs they actually cite 5, 6, 7 life expectancy was shown to have a positive and significant impact on economic growth. Also in the same vain Barro and Lee (1984) show that life expectancy has a significant positive impact on economic growth, in this project we want to look at the impact of health on development, with an initially hypothesis that health has a positive impact on economic growth.
Empirical Model Specification
The empirical model to estimate is a standard growth regression of the type in cross-country studies of the Barro- type regressions. Drawing Inspiration from the theoretical framework of an augmented neoclassical growth model above, we draw the following specifications.
Specification 1 (spec 1)

Specification 2 (spec 2)
 ….(2)
….(2)
Specification 3 (spec 3)
 ….(3)
….(3)
Specification 4 (spec 4)

Specification 5 (spec 5)
Specification 6 (spec 6)

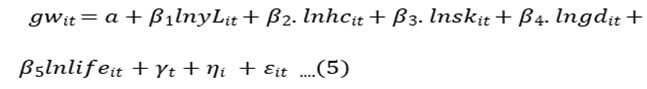
We estimated a simple liner regression model just to see what the linear relationship between the two variables we are using specification 1 and 4, in which we found a strong positive correlation between the variable. In our empirical specification we know gw is the growth rate par GDP capita, lnyL is the previous period GDP, emp is the employment rate or in other words the span of period an individual is engage, lnsk it’s the capital accumulation, gd is the growth rate of the population and ln life is the life expectancy of individuals. We could say γt is the time fixed effect or in other words year dummy and ηj is the country fixed effect or in other words country dummy. The last term refers to the idiosyncratic error term.
Data
The data set used in this project are from the Penn World (PWT) and the World Bank (WB). Among the variables there are real GDP, physical capital, population, education and life expectancy at birth. The population growth rate is measured as the average rate of growth of the working-age population, where the working age is defined as 15 to 65, covering 182 countries between 1950 and 2017. Table 1.
Table 1. Summary statistics for the dataset used| Statistic | N | Mean | St. Dev. | Min | Pctl(25) | Median | Pctl(75) | Max |
| Lny | 5,349 | 8.776 | 1.272 | 4.959 | 7.754 | 8.853 | 9.827 | 12.310 |
| Gw | 5,349 | 2.213 | 4.713 | -37.493 | 0.288 | 2.419 | 4.504 | 30.241 |
| Lnlife | 5,349 | 0.597 | 0.274 | 0.000 | 0.371 | 0.625 | 0.836 | 1.000 |
| lnlifeL | 5,349 | 0.579 | 0.275 | 0.000 | 0.356 | 0.609 | 0.819 | 1.000 |
| lnyL | 5,349 | 8.666 | 1.254 | 4.959 | 7.663 | 8.691 | 9.672 | 12.409 |
| Lnhc | 5,349 | 0.535 | 0.302 | 0.000 | 0.271 | 0.552 | 0.807 | 1.000 |
| Lnsk | 5,349 | -1.668 | 0.553 | -4.983 | -1.946 | -1.560 | -1.313 | -0.358 |
| Lngd | 5,349 | -2.719 | 0.223 | -7.634 | -2.865 | -2.704 | -2.572 | -1.486 |
| Lnemp | 5,349 | -0.986 | 0.257 | -1.985 | -1.141 | -0.952 | -0.802 | -0.276 |
| lnemp2 | 5,349 | 1.038 | 0.558 | 0.076 | 0.643 | 0.906 | 1.301 | 3.939 |
The data for 182 countries show that in the above table the summary of statistic of our data used in this project, we could observe that the mean of log output per capita growth rate of 8.776 per year with standard deviation 1.272. The minimum output rate is 4.959 and maximum is 12.310. The mean of employment is -0.986 with a standard deviation of 0.257 the minimum and maximum are -1.985 and -0.276 respectively. Average human capital is low, while growth is high in our panel. Human capital is measured by an index of returns to schooling and average years of schooling. The growth variable is the most disperse, while human capital show little variation among the panel. Lnemp is negative across because it’s a percentage below 1 and lnemp^2 is the square so it must be positive. Figure 1, Figure 2.
Figure 1. Information Criteria for the sixth model specification (spec 6) pairwise plots 
Download figure
Figure 2. Information Criteria for the third model specification (spec 3) pairwise plots 
Download figure
The above graphs specification 6 and specification 3 which are actually controlling time and country fixed effects, are an affirmation that our data “must not be cluster”. We could observe that ICL criteria gets worst when we add more components. This is also supported by the pair wise plot which actually shows no meaningful cluster at a visual inspection. Table 2.
Table 2. The main econometrics regression results for the dependent variable.| Dependent variable: Regression results | ||||||
| (spec 1) | (spec 2) | (spec 3) | (spec 4) | (spec 5) | (spec 6) | |
| Lny | Lny | Lny | Gw | Gw | Gw | |
| (1) | (2) | (3) | (4) | (5) | (6) | |
| Lnlife | 0.923*** | 0.331*** | 0.307*** | 1.764*** | 3.855*** | 3.716*** |
| (0.062) | (0.036) | (0.035) | (0.234) | (0.457) | (0.453) | |
| lnyL | -5.524*** | -5.824*** | ||||
| (0.168) | (0.170) | |||||
| Lnsk | 0.017 | 0.002 | 0.927*** | 0.803*** | ||
| (0.012) | (0.012) | (0.155) | (0.154) | |||
| Lnhc | -0.203*** | -0.174*** | 3.800*** | 3.831*** | ||
| (0.052) | (0.051) | (0.671) | (0.667) | |||
| Lngd | 0.049 | 0.061** | 2.519*** | 2.605*** | ||
| (0.031) | (0.030) | (0.394) | (0.393) | |||
| Lnemp | 1.360*** | 9.507*** | ||||
| (0.158) | (2.073) | |||||
| lnemp2 | 0.313*** | 1.869* | ||||
| (0.073) | (0.955) | |||||
| Country Effects | No | Yes | Yes | No | Yes | Yes |
| Time Effects | No | Yes | Yes | No | Yes | Yes |
| Observations | 5,349 | 5,349 | 5,349 | 5,349 | 5,349 | 5,349 |
| R2 | 0.040 | 0.949 | 0.952 | 0.011 | 0.387 | 0.399 |
| Adjusted R2 | 0.039 | 0.947 | 0.950 | 0.010 | 0.367 | 0.378 |
| ResidualStd.Error | 1.247 (df = 5347) | 0.292 (df = 5172) | 0.285 (df = 5170) | 4.689 (df = 5347) | 3.751 (df = 5171) | 3.718 (df = 5169) |
| F Statistic | 220.132*** (df = 1;5347) | 546.336*** (df = 176;5172) | 570.083*** (df = 178;5170) | 56.899*** (df = 1;5347) | 18.481*** (df = 177;5171) | 19.133*** (df = 179;5169) |
This section presents and analyzes the results of our main methodological approach, on the effect of health on economic growth. Our result is consistent with some theoretical augments as well microeconomic evidence, is that health has a positive and statistically significant effect on economic growth. From all our models we could see that “lnlife” is positive and significant across all specification which is a proxy for health, meaning health have a positive impact on output per capita and as well the growth rate across our result was in line with David Canning (2001),
David E. Bloom(2001) and Jaypee Sevilla(2001).We could observe that lnyL which is the previous period GDP interprets as the more we are producing the less we are growing, meaning production beyond the thresh whole which eventually lead to a decline of the growth rate, for “lnsk” could be interpreted as the more capital we have the more we are producing and growing. The human capital coefficient has a positive impact on feature growth rate in other words we could say that human capital today is associated with lower level of GDP in the previous year.
Conclusion
This Project work investigates the relationship between health and economic growth for a sample of 182 countries within the span of 1950-2017. To my knowledge, this is the first study of Health on economic growth employing technique to verify if our data must be “clustered” or not. The investigation in conducted in line with the Barro-type cross-country regression model, taking inspiration from the augmented neoclassical growth theoretical framework. Based on the hypothesis that health affect economic growth under differing levels of conditions, our empirical models include both employment and human capital, and employment square. The sample of countries comprise 182 countries based on data availability, well above the 23 sub-Saharan African countries in jorbateh (2019) and limited ECOWAS countries. 11
On the planks on better methodology and larger set of a sample of countries, this project broadly shows that, in line with theoretical models, the individual effects of health, employment and human capital on per capita economic growth is significantly positive. Our findings have a paramount policy implication, while policies that promote health and human capital development may be advanced in order to harness better economic growth in the region.
Further studies will benefit from investigating other dimensions of health care system such as access and efficiency or data on medical institutions and access to medication. In this line, exploiting recent data on overall health care system, medical institutions, and Inequalities that exist in healthcare and medicine could be interesting, further studies can be conducted along the line of endogenous threshold methods like panel threshold regression model (PSTR) or dynamic panel threshold model. Finally, further studies may be conducted on the correlation between the quality of patient service and revenue for both African and European countries.
References
- 1.Bloom D, Sachs J. (1998) . Geography, Demography, and Economic Growth in Africa. Brookings Papers on Economic Activity 2, 207-73.
- 2.J L Gallup, J D Sachs, Mellinger A. (1999) Geography and Economic Development.". , International Regional Science Review 22, 179-232.
- 3.Heckman J, Klenow P. Human Capital Policy. University of Chicago (1997) Determinants of democracy. , Journal of Political Economy 107(6), 15883.
- 4.R J arro, Martin i, S X. (2004) Economic Growth. Sources of economic growth. Carnegie-Rochester Conference Series on Public Policy 40, 146.
- 5.Bhargava A, D T Jamison, L J, C J Murray. (2001) Modeling the effects of health on economic growth. , Journal of Health Economics 20, 423440.
- 6.Blackburn K, G P Cipriani. (2002) A model of longevity, fertility and growth. , Journal of Economic Dynamics and Control 26(2), 187204.
- 7.Adeyi O, Smith O, Robles S. (2007) Public policy and the challenge of chronic non communicable diseases. Washington: The World Bank;. 13.
- 8.Chancellor J V, Hill A M, Sabin C A, Simpson K N, Youle M. (1997) Modelling the cost effectiveness of lamivudine/zidovudine combination therapy in HIV infection. Pharmacoeconomics. 12(1), 54-66.