
Distribution Spread and Environmental Risk Status of Pb, Cd And Cr in Soils of an Open-Air Waste Dumpsite along Tombia/Amassoma Road in Yenagoa Metropolis
Abstract
In spite of the popularity of open-air waste dumping in Nigeria, it remains a relatively less effective waste management option across the globe because of its associated environmental impacts which includes the release of green house gases (GHGs), persistent organic pollutants (POPs), and metal micro-pollutants amongst others. This study aims to assess the potential environmental risks associated to metals released and vertically delineated across the soil profile within surroundings of dumpsite. Heavy metals in soil samples were acid-digested using the aqua-regia mixture of hydrochloric and nitric acid, followed by instrumentation analysis using the GBC 908 PBMT model atomic absorption spectrophotometer. Contaminated sites showed metal concentrations ranging from 1.493 to 109.460 mg/kg, 0.133 to 4.237 mg/kg, and 5.200 to 25.367 mg/kg for lead, cadmium and chromium respectively, with location 1 land area showing the most contamination. Only soil chromium was observed within regulatory stipulations in all cases. There was significant variation (p < 0.05) between the different sample locations, thereby indicating variations in composition of dumped wastes. Lead and cadmium showed the strongest positive correlation (r = 0.855, p < 0.01) and the application of some heavy metal pollution indicators revealed relatively higher metal loads and degree of contamination, as well as depicting potential ecological risk for soils of location 1. The significant heavy metal contamination of soils in the Tombia-Amassoma waste dumpsite requires that the local environmental sanitation and regulatory authorities take necessary remedial action to forestall the escalation of public health concerns that may emanate from this open-air dump.
Author Contributions
Academic Editor: Sylvester C. IZAH, PhD, Department of Biological Science, Niger Delta University, Nigeria.
Checked for plagiarism: Yes
Review by: Single-blind
Copyright © 2020 Aigberua Omozemoje Ayobami, et al.
 This is an open-access article distributed under the terms of the Creative Commons Attribution License, which permits unrestricted use, distribution, and reproduction in any medium, provided the original author and source are credited.
Competing interests
The authors have declared that no competing interests exist.
Citation:
Introduction
Solid waste trash in urban environments is the nature-derived products of man’s daily undertakings, especially in populated, bustling cities of developing nations. Whilst urbanization leads to a rapid rise in human population growth, it equally mounts pressure on production to meet demands. Consequently, the increasing multiplication of wastes, coupled with inappropriate waste discharge options continues to pose a major health challenge for the government and people to tackle 1. Waste dumping, though a popular waste management practice, is among the less effective and desired options of managing trash. In spite of this, vast tonnes of waste are still being junked in open-air solid waste dumpsites globally 1, 2. The limited capacity to reprocess wastes, especially in economically developing nations is reason for having a higher fraction of municipal debris going to open waste dumps 3. Often times, these wastes are not segregated into their decomposable and non-decomposable fractions 4. In fact, tendencies are that numerous metropolitan cities of emergent countries will continue to be hounded with the varying adverse ecological changes posed by this waste management practice 5. Quite frankly, the Nigerian perspective for dealing with wastes does not reflect any positive deviation from this trend as six of the largest dumpsites in Africa are situated in the metropolitan cities of Lagos (Oluosun, Solous 2 and Epe), Ibadan (Awotan-Apete and Lapite) and Port Harcourt (Eneka) open dumpsites 1, 6.
Municipal waste dumping has become an urban menace due to limited infrastructure to cater for the rapid development of sprawling towns and cities. Many cities are unable to provide basic social utilities spanning from housing, portable underground water and effective handling of solid squanders, thereby resulting to the mounting heaps of trash in sanitary landfills and open-air dumps, serving as hotbed for disease-carrying rodents and insects. Garbage dumping grounds are dotted within, and at outlying areas of Nigerian towns, which as a result of poor waste handling methods have continued to compromise the health conditions of those residing within close proximity of scrap sites. A decimation of self-reported illnesses has been reported with extended distances of human residence from dump grounds 7, while land-fills in the vicinity of riverine communities may often result in overwhelming eutrophication processes 8.
Every day, several million tons of municipal scrap wastes are been disposed worldwide, with methane (a greenhouse gas (GHG)) making up about half the fractional constituent of land-fill gas (LFG) and responsible for over 10% global emissions of methane. The rising levels of atmospheric methane, one of the GHGs responsible for global warming is sufficient reason for governments, especially of third-world countries, to enlighten and initiate modern waste reprocessing operations, reduce GHGs and similar atmospheric emissions by trapping as land-fill gas energy, one that will not only serve as an ameliorative policy to reduce the impact of ozone depletion but also aid in restoring the environment and decimating associated public health hazards, alongside improving energy independence and exploiting other socio-economic benefits 1, 9, 10.
The high mobility and bioavailability of contaminant heavy metals in dump yards increases their risk of infiltrating surrounding ground water systems and stretches their toxic impact through the food chain. Most especially, lead and cadmium are among the metals on “red alert” based on their environmental unfriendliness, bio-accumulation tendencies and cumulative toxicant effects to body tissues and organs. Even trace contamination of soil by heavy metals can have far-reaching effects on the health of man and his environment, whilst constituting prolonged menace to water and ecosystems, or absorbing through plant roots and other biodiversity growing in abandoned waste dumpsites 4, 11, 12, 13, 14, 15, 16. The menace from leaching municipal waste dumps is proliferated depending on the waste content, bulk volume of trash, lifetime of waste dung, prevailing thermal conditions, water content, oxygenation levels, soil formation type and comparative separation from human and aquatic habitation 13, 17, 18.
The key operational shortfalls that were observed at dumpsites in the Niger Delta were poor sanitary practices, poor manning and monitoring of daily activities, an evident lack of tools and equipment required for executing routine cleaning operations, the absence of anti-contamination apparatus for detoxifying leached dump effluents, unavailability of gas recollection systems, non-existent fire-fighting instrument, dearth of environmental buffer areas and the absence of barricades around waste dump yards, followed by the lack of safety training for waste handlers and the likelihood of their exposure to disease conditions 19. About 2.1% of responses from some interviewed Yenagoa residents revealed good recognition of waste handling procedures (95.4%), utilization of waste receptacles (86.7%), relatively effective waste collection by environmental sanitation authorities (70.4%), practice of open-air incineration (6.3%), dumping into rivers and storm water drains, or by roadsides (5.0%), stacking at backyards (2.1%) 20.
Apart from the atmospheric concomitants that are released from open dumpsites, the surrounding soils and leachate from trash dumpsites pose potential pollution problems by way of reducing soil fertility and compromising surface and underground water quality as a result of the vertical delineation of micro-pollutants such as trace/heavy metals, persistent organic pollutants and anions through the soil strata. From the foregoing, this study aims to assess the extent of environmental risks posed by some soil available trace metals within vicinity of the Tombia/Amassoma dumpsite by applying some heavy metal pollution indices.
Materials and Method
Description of Study Area
Like the rest of Niger Delta environment, climate is classified into the dry and rainy seasons with temperatures reaching about 35oC all through the year 21. The dumpsite at Tombia-Amassoma road is located in Yenagoa Local Government Area of Bayelsa State. It is strategically sited over 1 km away from the closest human habitation, within the geographical coordinates of latitude N4o58’57.654” and longitude E6o19’27.498”. Also, the control site is located about 3 km away from trash site, within close proximity of Tombia junction.
Sample Collection
A triangular soil sampling section was established around the Tombia-Amassoma garbage dumpsite. Eleven (11) grab samples of soil was collected at three (3) depths of 0.3, 0.5 and 1.0 m respectively for each of three (3) locations at each edge of the triangular sampling quadrant, as well as duplicate top soil zones (0.3 metre) of control location. Specifically, nine (9) waste dump soils and another two (2) from control were collected for metal analysis. The triangular sample distribution was chosen in a manner that reflected zones of heavy and mild municipal waste contamination of soil. This was done with the intent of assessing the impact and associated environmental risk of heavy metals released from the waste dung on soil quality. Sample area and control site information are highlighted in Table 1 below.
Table 1. Field sample information for waste dumpsite and control point| Sampling Location | Latitude | Longitude | Site description | 0.3m depth | 0.5m depth | 1.0m depth | Number of samples |
|---|---|---|---|---|---|---|---|
| Location 1 | N4o58’57.654” | E6o19’27.498” | Heavily polluted area | Sampled | Sampled | Sampled | 3 |
| Location 2 | N4o58’54.102” | E6o19’25.086” | Medium (mildly) polluted area | Sampled | Sampled | Sampled | 3 |
| Location 3 | N4o58’56.19” | E6o19’21.462” | Medium (mildly) polluted area | Sampled | Sampled | Sampled | 3 |
| Control ½ | N4o57’42.264” | E6o21’7.884” | No visible trace of pollution | Sampled | Not sampled | Not sampled | 2 |
Sampling was executed during the dry season period of March 2020. The samples were collected at different geo-spatial locations and the co-ordinates established via a Garmin Etrex GPS instrument. The control point was sited way off the waste dump area at a distance of about 3 km away. Soil samples were collected using depth-calibrated soil auger and transferred into Ziploc bags before being transported to the laboratory.
Materials & Methods
Acid Digestion Protocol for Heavy Metals in Soil
Room temperature air-dried soil samples were homogenized by grinding and segregated into the required soil diameter of ≤ 2 mm by sieving through 2 mm mesh sieve. Exactly 5 g of each soil was sub-sampled into 100 ml glass beaker, followed by the addition of 1 ml concentrated nitric acid (HNO3) (s.g 1.42), 10 ml of concentrated hydrochloric acid (HCl) (s.g 1.19) and about 20 ml distilled water. Another empty glass beaker containing the same ratio of acid/water mixtures was digested and labeled as “reagent blank”. Samples were digested on a Corning PC-351 model hot plate at medium to low heat until about 5 ml concentrated extract was remaining. The content of the beaker was left to cool for around 30 minutes. Afterwards, solutions were filtered and quantitatively conveyed into 50 ml standard flasks. Finally, filtered solutions were marked up with distilled water 21, 22. Test metals were determined using the GBC 908PBMT model Flame Atomic Absorption Spectrophotometer (FAAS). Each sample was individually presented for aspiration into the FAAS and their vaporized fractions were nebulized in the air-acetylene flame using different fuel/oxidant ratios (Table 2). Instrument calibration standards for metals, and the respective sample concentrations were recorded in mg/l units. The heavy metal stock solutions of 1,000 mg/l were sub-stocked into working concentrations of 0.5, 1.0, 2.0, 5.0, 10.0 and 100.0 mg/l for lead, cadmium and chromium. Each of the metals was detected at wavelengths of 217.0, 228.8 and 357.9 nm for lead, cadmium and chromium respectively. To gain assurance of quality, distilled water was aspirated by the FAAS as blank solution 21.
Table 2. Operational settings and condition of FAAS| Metals - | Slit width (nm) | Wavelength (nm) | Lamp current (mA) | Flame composition Acetylene Air (L/min) (L/min) | Check standard concentration, (mg/L) | Detection limit (mg/L) | |
| Pb | 1.00 | 217.0 | 5.0 | 2.0 | 10.0 | 0.5 | 0.02 |
| Cr | 0.2 | 357.9 | 6.0 | 3.2 | 10.0 | 0.5 | 0.006 |
| Cd | 0.5 | 228.8 | 3.0 | 2.0 | 10.0 | 0.5 | 0.001 |
Analysis of Statistics
In order to determine the relation and variance among the different heavy metals of Tombia-Amassoma waste dumpsite soil, descriptive statistical analysis by statistical package for social science (SPSS) version 20 was applied. Data was recorded as mean ± standard error. The range of values obtained for the sampling points were equally presented. One way analysis of variance (ANOVA) was used to reveal significant variation at P = 0.05. Where significant variation was depicted, Waller-Duncan statistics was applied for mean value comparison of test metals. Heavy metal relationships were correlated by the Spearman’s rho correlation matrix.
Establishment of Baseline/control Values for the Assessment of Environmental Risk Factors
Heavy metal data from the control/uncontaminated soil was compared against results from the waste dump contaminated soil, information obtained was used to assess environmental risk factors. This has previously been applied in different environmental contamination scenarios (oil contaminated soil and sediment) 22, 23, 24.
Environmental Risks
Contamination Factor and Degree of Contamination
Contamination factor and degree of contamination was calculated on the basis of method developed by 25.
Contamination factor =
 …. (1)
The values obtained were classified as; Cf < 1 (low contamination), 1 ≤ Cf < 3 (moderate contamination), 3 ≤ Cf <6 (considerable contamination) and Cf ≥ 6 (very high contamination).
Degree of contamination =
 …… (2)
The degree of contamination was classify as; Cd < 8 (low risk), 8 ≤ Cd <16 (moderate risk), 16 ≤ Cd < 32 (considerable risk) and Cd > 32 (very high risk).
Pollution Load Index
Pollution load index calculations were applied on the basis of methods previously given 26, 27, 28, 29. The pollution load indicator was categorized as; PLI < 1 (no pollution); 1 < PLI < 2 (moderate pollution); 2 < PLI < 3 (heavy pollution); 3 < PLI (extremely heavy pollution).
Pollution Load Index =
 .…… (3)
Geo-accumulation Index
The geo-accumulation indicator was calculated as per method developed by 30 and categorized using the formula given by 27, thus, I-geo ≤ 0 (uncontaminated), 0 < I-geo ≤ 1 (tending from uncontaminated to moderate contamination), 1 < I-geo ≤ 2 (moderate contamination), 2 < I-geo ≤ 3 (tending from moderate to heavy contamination), 3 < I-geo ≤ 4 (heavy contamination), 4 < I-geo ≤ 5 (tending from heavy to extreme contamination) and I-geo ≥ 5 (extreme contamination).
Geo-accumulation index = Log2 ...…… (4)
Where HM(s) is metal concentration in affected soil and HM(c) is metal concentration in control/unaffected plot.
Quantification of Contamination
Quantification of contamination was deduced by the application of method previously given by 27. Basically, positive values depict contamination.
Quantification of contamination, QoC (%) =  ……… (5)
Where, Cn and Bn represent the metal levels in the contaminated site and baseline (control station) respectively.
Potential Ecological Risk (PER)
Potential ecological risk indicator and risk indicator was calculated based on the methods developed by Hakanson 25.
Potential ecological risk = toxic factor x contamination factor.
Mathematically expressed as  ......... (6)
The toxic factor for the various metals studied include Pb = 5, Cd = 30 and Cr = 2 25. The ecological risks were classified as Er < 40 (low PER), 40 ≤ Er < 80 (moderate PER), 80 ≤ Er < 160 (considerable PER), 160 ≤ Er < 320 (high PER) and Er ≥ 320 (very high PER).
Risk index, RI =  ……… (7)
The values were classified as; R’ < 150 (low RI), 150 ≤ R’ < 300 (moderate RI), 300 ≤ R’ < 600 (considerable RI) and R’ ≥ 600 (very high RI).
Results and Discussion
Table 3 presents the heavy metals in soils around the dumpsite along Tombia-Amassoma road in Yenagoa metropolis, while the Spearman’s rho correlation matrix of heavy metals in dumpsite soil is highlighted in Table 4. Lead concentrations ranged from 5.597 to 109.460 mg/kg, 1.763 to 75.427 mg/kg and 1.493 to 67.470 mg/kg for top soils (0.3 m), mid-depth soils (0.5 m) and bottom soils (1.0 m) of dumpsite contaminated soils respectively. Cadmium levels reportedly between 0.550 and 3.143 mg/kg, 0.247 and 4.237 mg/kg and 0.133 and 2.807 mg/kg for top soils (0.3 m), mid-depth soils (0.5 m) and bottom soils (1.0m) of the dumpsite contaminated soils respectively. Finally, chromium concentrations ranged from 8.377 to 22.183 mg/kg, 6.443 to 25.367 mg/kg and 5.200 to 14.877 mg/kg for top soils (0.3 m), mid-depth soils (0.5 m) and bottom soils (1.0m) of the dumpsite contaminated soils respectively (Table 3).
Table 3. Heavy metals distribution in contaminated and uncontaminated soils| Locations | Pb | Cd | Cr |
|---|---|---|---|
| TA Loc SS1T | 109.460±5.049f | 3.143±0.178e | 22.183±1.747g |
| TA Loc SS1M | 75.427±2.935e | 4.237±0.458f | 25.367±1.420h |
| TA Loc SS1B | 67.470±3.318d | 2.807±0.316d | 14.877±1.078f |
| TA Loc SS2T | 15.217±0.908c | 0.910±0.141c | 12.550±0.620e |
| TA Loc SS2M | 2.097±0.220ab | 0.437±0.085ab | 6.443±0.716ab |
| TA Loc SS2B | 1.493±0.159a | 0.133±0.025a | 5.200±0.360a |
| TA Loc SS3T | 5.597±0.571b | 0.550±0.070b | 8.377±1.058cd |
| TA Loc SS3M | 1.763±0.279ab | 0.247±0.050ab | 7.397±0.950bc |
| TA Loc SS3B | 3.463±0.339ab | 0.197±0.040a | 5.310±0.338a |
| TA Control SS1T | 1.660±0.244a | 0.210±0.040ab | 9.453±0.794d |
| TA Control SS2T | 2.957±0.285ab | 0.223±0.025ab | 10.107±0.725d |
On the other hand, only top soils (0.3 m) were collected for the control locations with values ranging from lead (1.660 to 2.957 mg/kg), cadmium (0.210 to 0.223 mg/kg) and chromium (9.453 to 10.107 mg/kg) respectively. Apart from the top soil of dumpsite location 1 (0.3 m), lead in soil was predominantly within the Department of Petroleum Resources (DPR) target value of 85 mg/kg. Also, soil chromium was within DPR target value of 100 mg/kg for all dumpsite-contaminated locations. However, all three (3) soil depths of sample location 1 and top soil (0.3 m) of location 2 showed cadmium values exceeding the DPR target concentration. In spite of the conformance of metal concentrations recorded in the dumpsite to DPR intervention levels, it is pertinent to identify concentrations exceeding target values as being environmentally significant and possessing hazardous potential. On the other hand, soils of both control locations revealed relatively lower heavy metal concentrations, with all values being within stipulated DPR target and intervention levels. All other sampling locations and depths were within the specified regulatory target and intervention levels of 0.8 and 12 mg/kg for cadmium in soil (Table 3) 31.
Most notably is the fact that all sampled depths of location 1 and the top soil of location 2 consistently showed significant difference (p < 0.05) for all the metals been analyzed. The locations with no significant difference (p > 0.05) includes: midpoint (0.5 m) and bottom soils (1.0 m) of locations 2 and 3 for lead and cadmium, and bottom soils (1.0 m) of locations 2 and 3 for chromium (Table 3). In addition, the strongest and weakest positive correlations were between lead and cadmium (r = 0.855, p < 0.01), and lead and chromium (r = 0.787, p < 0.01) respectively, with cadmium also showing positive correlation with chromium (r = 0.829, p < 0.01) (Table 4).
Table 4. Spearman's rho correlation matrix for test metals| Metals | Pb | Cd | Cr |
|---|---|---|---|
| Pb | 1.000 | ||
| Cd | .855** | 1.000 | |
| Cr | .787** | .829** | 1.000 |
Heavy metal levels in the study area is higher than values previously reported in soils around the embankment of effluent wastewater retention pits in the Niger Delta 32, the oil flow station at Imiringi community in Bayelsa State 21, Rumuolukwu community oil spill site 22, residual fractions of dumpsite soils in a mangrove forest at Eagle Island 33, crude oil contaminated soils of Bdere community in Ogoni land 34, 35. However, chromium values in this study was lower than earlier reported by 36 for soils from an abattoir dumping site. Statistically, the soil metals showed positive correlation with each other, suggesting that they may be from similar source 21, 37, 38. The correlation trend of heavy metals in sediment, as reported in this study, corroborates the report of 21 where lead, nickel and iron depicted positive correlations. Similar to the findings of 39 where statistical analysis revealed statistical variations in metal levels of dumpsite soils, this study revealed similar trend among metal concentrations and locations.
Obviously, there is a connection between soil quality and heavy metal levels 39, 40, 41, 42, 43. Most metal contaminants often depict elevated levels of distribution spread during the dry season 14, 22, 36. Hence, the concentration of heavy metals in soils within vicinity of open-air dumpsite is observed to be higher than those collected from natural uncontaminated environments 14, 33. Furthermore, studies have shown that the levels of these contaminant metals in soils around municipal waste dumpsites are not dependent on the life time of the dump area but on the origin/cause, make up and terrain of the waste dump 44.
Mutually Dependent and Independent Heavy Metal Associations in Soils of Open Waste-Dump
Cluster analysis was applied in the identification of variables (sample location/depths and metals distribution spread) of close affiliation within the study area. Heavy metals of common dependence showed homogeneity in element while those of correlative independence depicted diverging attributes. For the test metals, there was similarity between soil cadmium (Cd) and chromium (Cr) across the study locations. Hence, lead (Pb) was reflected as the mutually independent heavy metal variable (Figure 1). On the other hand, dumpsite-contaminated sections at the top (0.3 m), midpoint (0.5 m) and bottom soils (1.0 m) of location 1 showed mutual dependence. However, soil strata from location 1 were mutually independent of soils from control, locations 2 and 3. Hence, all other metals of the control and sample locations 2 and 3 were closely interlinked (Figure 2). Contrary to the reported metal association between cadmium (Cd) and chromium (Cr) as highlighted in this study, 35 had reported strong relationship between chromium (Cr) and iron (Fe) for soils contaminated with crude oil. Also, there was strong association between lead (Pb) and cadmium (Cd) in soils of a waste dumpsite in a mangrove forest within Eagle Island, Rivers State 33.
Figure 1.Hierarchical cluster analysis of test metals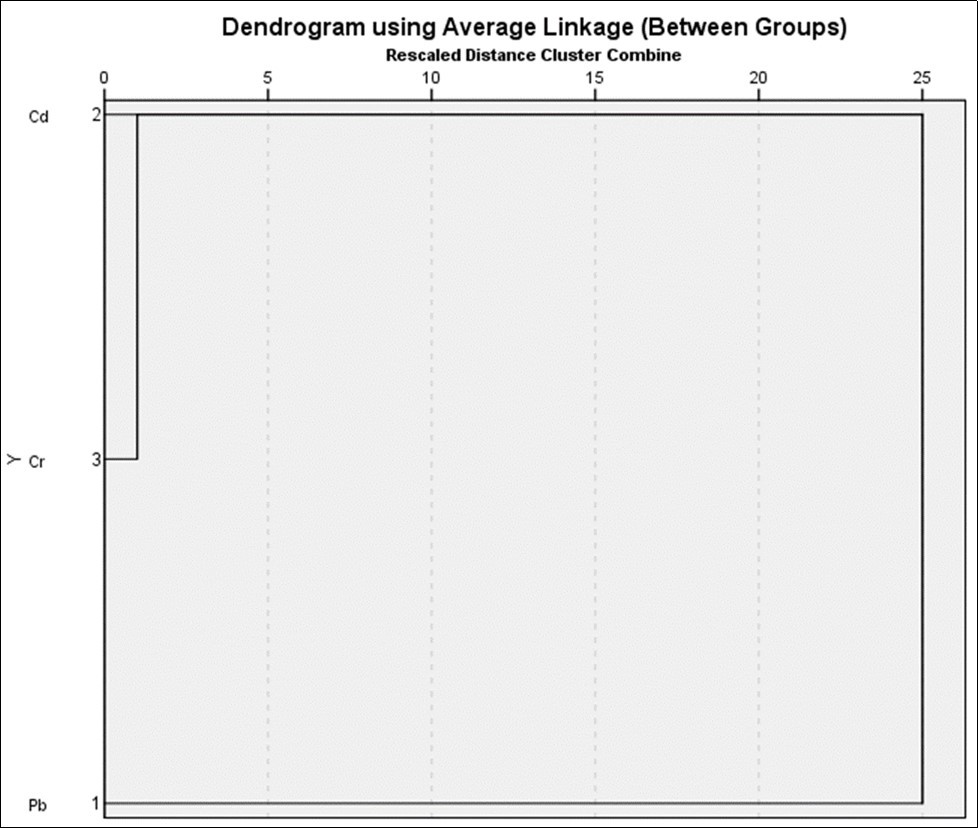
Figure 2.Hierarchical cluster analysis based on spatial distribution
There was very high contamination factor across the top, mid and bottom soil depths of location 1 and the top soil of location 2 (Cf ≥ 6). Apart from the top (0.3 m) and bottom (1.0 m) depths of location 3 which depicted moderate contamination (1 ≤ Cf< 3), all other points revealed relatively low contamination (Cf < 1) (Table 5). Based on the result of this study, Cf values were lower than earlier reported for oil contaminated soils of Rumuolukwu 22. However, the values exceeded those reported for sediments of the Nun River 24 and sediments of Kolo creek 21. Even though lead and cadmium contamination factors in this study exceeded those reported in sediments of communities of Taylor creek, they were lower than the chromium contamination factors reported by 45.
Table 5. Contamination factors, degree of contamination and pollution load index of test metals in soils of Tombia-Amassoma waste dumpsite| Locations | Contamination factor | Degree of contamination | Pollution Load index | ||
|---|---|---|---|---|---|
| Pb | Cd | Cr | |||
| TA Loc SS1T | 47.4 | 14.5 | 2.3 | 64.2 | 11.6 |
| TA Loc SS1M | 32.7 | 19.5 | 2.6 | 54.8 | 11.8 |
| TA Loc SS1B | 29.2 | 12.9 | 1.5 | 43.7 | 8.3 |
| TA Loc SS2T | 6.6 | 4.2 | 1.3 | 12.1 | 3.3 |
| TA Loc SS2M | 0.9 | 2.0 | 0.7 | 3.6 | 1.1 |
| TA Loc SS2B | 0.7 | 0.6 | 0.5 | 1.8 | 0.6 |
| TA Loc SS3T | 2.4 | 2.5 | 0.9 | 5.8 | 1.7 |
| TA Loc SS3M | 0.8 | 1.1 | 0.8 | 2.7 | 0.9 |
| TA Loc SS3B | 1.5 | 0.9 | 0.5 | 3.0 | 0.9 |
In addition, only soil profile within location 1 showed high degree of contamination risk (Cd > 32), followed by the top soil of location 2 which revealed moderate degree of contamination risk (8 ≤ Cd < 16), all other soil profiles across the different soil locations were at low risk of contamination (Cd < 8) (Table 5). The degree of contamination risk in this study exceeded levels reported in sediments of Kolo creek under median and geometric mean considerations 21. Also, it surpassed Cd values reported for cassava effluent contaminated soils 46 and sediments from communities around Taylor creek 45.
Furthermore, pollution load index deductions showed extremely heavy pollution (3 < PLI) for all sample depths of location 1 and the top soil of location 2. On the other hand, soils collected at midpoint and top soil zones of locations 2 and 3 respectively showed moderate pollution (1 < PLI < 2) while the remaining sampling zones and profiles depicted no pollution (PLI < 1) (Table 5). Pollution levels were extremely heavy, especially in location 1 as compared to ranges between none to moderate pollution for sediments of the River Nun 24, none to heavy pollution for sediments of Taylor creek 45 and Kolo creek 21.
Stipulated Limits for Contamination Factor (Cf):
Cf < 1 (low contamination); 1 ≤ Cf < 3 (moderate contamination); 3 ≤ Cf < 6 (considerable contamination); Cf ≥ 6 (very high contamination).
Stipulated Limits for Degree of Contamination (Cd):
Cd < 8 (low risk); 8 ≤ Cd < 16 (moderate risk); 16 ≤ Cd < 32 (considerable risk); Cd > 32 (very high risk).
Stipulated Limits for Pollution Load Index (PLI):
PLI < 1 (no pollution); 1 < PLI < 2 (moderate pollution); 2 < PLI < 3 (heavy pollution); 3 < PLI (extremely heavy pollution).
Generally, the geo-accumulation index of lead showed tendencies between the range of uncontaminated to moderate contamination (0 < I-geo ≤ 1) and extreme contamination (I-geo > 5). Samples from location 1 showed extreme contamination up to the depth of 1.0 m. Only the top soil (0.3 m) of location 2 reflected moderate contamination levels (1 < I-geo < 2) while other contaminated soil locations revealed tendencies from uncontaminated to moderate contamination (0 < I-geo < 1) (Table 6). Also, cadmium I-geo depicted ranges between uncontaminated to moderate contamination (0 < I-geo ≤ 1) and heavy contamination (3 < I-geo ≤ 4). The land area of most contamination was location 1, especially mid-depth (0.5 m) soil which showed heavy contamination whilst the top (0.3 m) and bottom (1.0 m) soils of location 1 showed tendency from moderate to heavy contamination (2 < I-geo ≤ 3). On the other hand, samples across soil profiles of locations 2 and 3 revealed tendencies of uncontaminated to moderate contamination (0 < I-geo ≤ 1) (Table 6). In terms of chromium, all sample locations and the different soil depths portends I-geo tending from uncontaminated to moderate contamination (0 < I-geo ≤ 1) (Table 6). Based on the baseline/control plot consideration, results of this work showed higher levels of geo-accumulation index (I-geo) relative to the report of 27 for underground water, Izah et al. 47 for soils contaminated with cassava mill leachates, 24 for oil-contaminated sediments of the River Nun, 45 for sediments of Taylor creek, 38 on surface water sediment along Nun river in Bayelsa state, and 21 for surface water and sediment within vicinity of flow stations at Kolo creek. In addition, the high I-geo values was in contrast to predominantly low values reported by 21, the difference in trend may have emanated from the application of background consideration and/or the lithological value of 1.5 in the geo-accumulation index calculation 48.
Table 6. Geo-accumulation index and quantification of contamination of test metals in soils of Tombia-Amassoma waste dumpsite| Locations | Geo-accumulation index | Quantification of contamination | ||||
|---|---|---|---|---|---|---|
| Pb | Cd | Cr | Pb | Cd | Cr | |
| TA Loc SS1T | 9.5 | 2.9 | 0.5 | 97.9 | 93.1 | 55.9 |
| TA Loc SS1M | 6.6 | 3.9 | 0.5 | 96.9 | 94.9 | 61.4 |
| TA Loc SS1B | 5.9 | 2.6 | 0.3 | 96.6 | 92.3 | 34.3 |
| TA Loc SS2T | 1.3 | 0.8 | 0.3 | 84.8 | 76.2 | 22.1 |
| TA Loc SS2M | 0.2 | 0.4 | 0.1 | -10.1 | 50.3 | -51.8 |
| TA Loc SS2B | 0.1 | 0.1 | 0.1 | -54.7 | -63.2 | -88.1 |
| TA Loc SS3T | 0.5 | 0.5 | 0.2 | 58.7 | 60.5 | -16.7 |
| TA Loc SS3M | 0.2 | 0.2 | 0.2 | -31.0 | 12.1 | -32.2 |
| TA Loc SS3B | 0.3 | 0.2 | 0.1 | 33.3 | -10.2 | -84.2 |
The quantification of contamination of lead indicated contamination for all samples of location 1, top and mid-depth soils of location 2 and the top and bottom soils of location 3. However, the highest quantification of contamination was depicted in location 1. For cadmium, there was evidence of contamination in all samples apart from bottom (1.0 m) soils of locations 2 and 3. Finally, chromium revealed contamination across the three (3) soil depths of location 1 and the top profile of location 2. All other soil depths and sampling locations remained relatively uncontaminated (Table 6). Overall, samples revealed considerable extent of vertical pollution across the soil profiles, especially in soils of location 1. Similar to 21, sample locations of this study depicted positive values for quantification of contamination, giving credence to the anthropogenic sources of heavy metals from soils of the trash site environment.
Stipulated Limits for Geo-accumulation Index
I-geo ≤ 0 (uncontaminated), 0 < I-geo ≤ 1 (tending from uncontaminated to moderate contamination), 1 < I-geo ≤ 2 (moderate contamination), 2 < I-geo ≤ 3 (tending from moderate to heavy contamination), 3 < I-geo ≤ 4 (heavy contamination), 4 < I-geo ≤ 5 (tending from heavy to extreme contamination) and I-geo ≥ 5 (extreme contamination).
Quantification of Contamination
Positive Values Indicate Contamination.
In terms of the potential ecological risk of available lead in soils of the waste dumpsite, only top and mid-depth soils of location 1 showed high risk (160 ≤ Er < 320), followed by the bottom soil of location 1 which reflected considerable risk (80 ≤ Er < 160). Alternately, all other sample locations portend low risk (Er < 40). Similarly, PER of cadmium revealed very high risk (Er ≥ 320) for all sample depths of location 1, considerable risk (40 ≤ Er < 80) in the top soil of location 2, moderate risk for mid-depth and top soils of location 2 and 3 respectively, while all other locations depicted low risk (Er < 40). For chromium, all sampling locations and soil profiles revealed low risk (Er < 40). Er data obtained in this study far exceeded the ranges for lead (1.55 to 12.40) and cadmium (16.80 to 75.90) reported for sediments of Kolo creek in Bayelsa state 21. Overall, cadmium reflected greater ecological risk than lead for both studies. Conversely, 22 had reported higher ecological risk factor ranges of (5.0 to 283.0) and (2.8 to 12.4) for lead and chromium respectively. Table 7
Table 7. Potential ecological risk and risk index of test metals in soils of Tombia-Amassoma waste dumpsite LocationsRisk index| Locations | Potential ecological risk | Risk index | ||
|---|---|---|---|---|
| Pb | Cd | Cr | ||
| TA Loc SS1T | 237.1 | 434.4 | 4.5 | 676.0 |
| TA Loc SS1M | 163.4 | 585.9 | 5.2 | 754.5 |
| TA Loc SS1B | 146.1 | 388.2 | 3.0 | 537.3 |
| TA Loc SS2T | 33.0 | 125.7 | 2.6 | 161.3 |
| TA Loc SS2M | 4.6 | 60.3 | 1.3 | 66.2 |
| TA Loc SS2B | 3.3 | 18.3 | 1.1 | 22.7 |
| TA Loc SS3T | 12.1 | 75.9 | 1.7 | 89.7 |
| TA Loc SS3M | 3.8 | 34.2 | 1.5 | 39.5 |
| TA Loc SS3B | 7.5 | 27.3 | 1.1 | 35.9 |
Risk index showed very high risk (R’ ≥ 600) for top and midpoint soils of location 1, considerable (300 ≤ R’ < 600) and moderate (150 ≤ R’ < 300) risks for top and bottom soils of locations 1 and 2 respectively. All other sample locations were of low risk on the index scale. Similarly, RI data from this work surpassed the reported range of 24.30 to 93.15 in Kolo creek sediments 21.
Stipulated Limits for Potential Ecological Risk (PER):
Er < 40 (low risk), 40 ≤ Er < 80 (moderate risk), 80 ≤ Er < 160 (considerable risk), 160 ≤ Er < 320 (high risk) and Er ≥ 320 (very high risk).
Stipulated Limits for Risk Index (RI)
R’ < 150 (low risk), 150 ≤ R’ < 300 (moderate risk), 300 ≤ R’ < 600 (considerable risk) and R’ ≥ 600 (very high risk)
Conclusions
The soil quality status of the Tombia-Amassoma waste dumpsite is observed to be severely impacted by the leached waste run-offs resulting in reasonable vertical seepage of heavy metal micro-pollutants within the soil profile, even up to the depth of 1 m. Compared to the non-impacted control locations, the waste dump site showed relatively higher distribution of test metals, especially at location 1, where two non-essential metals (lead and cadmium) recorded toxic concentrations exceeding stipulated regulatory limits. There was statistical significance across the varying sample locations which depicted varying contamination point sources. This may have emanated from the divergent origins of dumped waste. Lead and cadmium were strongly associated contaminants, both reflecting elevated environmental metal loading, potential ecological risk and significant contamination levels. In view of the prevailing metal contamination within the impacted soil environment, it is pertinent that proactive steps are taken by relevant local environmental authorities and stakeholders to ensure that proper sanitary conditions are kept, an environmental remediation plan is instituted and more effective waste management options are adopted in order to cope with emerging waste generation challenges which will likely persist as a result of increasing urbanization and industrialization of Yenagoa metropolis.
References
- 1.Nwosu E E, Pepple G T. (2016) Site Selection and Analysis of Solid Waste Dumpsites in Ile-Ife, Nigeria(8363).FIG Working Week2016,Recovery form Disaster Christchurch,New Zealand2-6May2016.
- 2.Smith A, Brown K, Ogilvie S, Rushton K. (2001) Waste Management Options and Climate Change Report to the European Commission.
- 3.Akinwale A. Lund University, Sweden (2004) The Potential for Climate Change Mitigation in the Nigerian Solid Waste Disposal Sector: A Case Study from Lagos. (MSc.).
- 4.Tanee F B G, T N Eshalomi-Mario. (2015) Heavy Metal Contents in Plants and Soils in Abandoned Solid Waste Dumpsites in Port Harcourt. , Nigeria.Research Journal of Environmental Toxicology 9(6), 342-349.
- 5.F O Omotosho. (2004) A reflection on the hazards of sea pollution:. Case of Minmata disease in Japan. Paper presented at the proceeding of the 12thAnnual National Conference of EBAN , Abeokuta, Nigeria .
- 6.Arogundade S. (2019) A Glance at Biggest Dumpsites in Nigeria. Available online:October16,2019.https://www.bioenergyconsult.com/biggest-dumpsites-in-Nigeria/.
- 7.I O Ogunrinola, E O Adepegba. (2012) Health and Economic Implications of Waste Dumpsites in Cities: The Case of Lagos. , Nigeria.International Journal of Economics and Finance 4(4), 239-251.
- 8.D I Igbinomwanhia, A I Obanor, Y P Olisa. (2014) Characterization of Domestic Solid Waste for the Determination of Waste Management Option in Amassoma. , Bayelsa State, Nigeria.J. Appl. Sci. Environ. Manage 18(2), 211-215.
- 9. (2010) Environmental Protection Agency (EPA). Landfill recovery use in Nigeria (pre-feasibility studies of using LFGE).Methane-To-MarketsProgram,U.S.Environmental Protection Agency,1200Pennsylvania Avenue. , NW Washington, DC20460
- 10.Ikpeze N. (2014) Safe disposal of municipal wastes in Nigeria: Perspectives on a rights based approach.AfeBabalola University:. , Journal of Sustainable Development Law and Policy 3, 1.
- 11.R J Slack, J R Gronow, Voulvoulis N. (2005) Household hazardous waste in municipal landfills: contaminants in leachate.Sci. , Total Environ 337, 1-3.
- 12.Awokunmi E E, Asaolu S S, Ipinmoroti K O. (2010) Effect of leaching on heavy metals concentration of soil in some dumpsites.African. , Journal of Environmental Science and Technology 4(8), 495-499.
- 13.Abdus-Salam N, Ibrahim M S, Fatoyinbo F T. (2011) Dumpsites In. A Silent Pollution Zone for Underground Water.Waste Management and Bioresource Technology , Lokoja, Nigeria: 1, 21-30.
- 14.Ajah K C, Ademiluyi J, Nnaji C C. (2015) Spatiality, Seasonality and ecological risks of heavy metals in the vicinity of a degenerate municipal central dumpsite in Enugu. , Nigeria.Journal of Environmental Health Science and Engineering 13, 15.
- 15.Angaye TCN, Daokoru-Olukole C, Abowei JFN. (2018) Environmental Impacts of Municipal Solid Wastes in Yenagoa Metropolis. , Bayelsa State, Nigeria.Biotechnol. Res 4(1), 17-23.
- 16.Vongdala N, Tran H, T D Xuan, Teschke R, T D Khanh. (2018) Heavy Metal Accumulation in Water, Soil. , and Plants of Municipal Solid Waste Landfill in Vientiane, Laos.Int. J. Environ. Res. Public Health 16, 22.
- 17.Ogundiran O O, Afolabi T A. (2008) Assessment of the physicochemical parameters and heavy metal toxicity of leachates from municipal solid waste open dumpsite.Int. , J. Environ. Sci. Tech 5(2), 243-250.
- 18.E O Longe, M R Balogun. (2010) Groundwater Quality Assessment near a Municipal Landfill. , Lagos, Nigeria.Res, J. Appl. Sci. Eng. Technology 2(1), 39-44.
- 19.Owoeye I O G, O H. (2013) Environmental audit of a refuse dump site in the Niger Delta Region of. , Nigeria.Journal of Public Health and Epidemiology 5(2), 59-65.
- 20.H O Stanley, C S Orakwuemma, B O Onumajuru, A S Opukeme, L O Onaghise. (2018) . , Assessment of Solid Waste Disposal in Yenagoa, Bayelsa State, Nigeria.Asian Journal of Advanced Research and Reports 1(4), 1-14.
- 21.S A Uzoekwe, A O. (2019) Heavy Metal Distribution and Assessment of Ecological Risk. in Surface Waters and Sediment Within the Flow stations in Kolo Creek, Nigeria.J. Chem. Soc , Nigeria 44(5), 809-824.
- 22.Aigberua A O, Ekubo A T, Inengite A K, Izah S C. (2017) Assessment of some selected heavy metals and their pollution indices in an oil spill contaminated soil in the Niger Delta: a case of Rumuolukwu community,Biotechnol. , Res 3(1), 1-5.
- 23.A K Inengite, N C Oforka, L C Osuji. (2010) Survey of heavy metals in sediments of Kolo creek in the Niger Delta. , Nigeria.African Journal of Environmental Science and Technology 4(9), 558-566.
- 24.Aigberua A O, Tarawou T. (2018) Ecological Risk Assessment of Selected Elements in Sediments from. , Communities of the river Nun, Bayelsa State, Nigeria,J. Environ. Bio. Res 2(1), 1-5.
- 25.Hakanson L. (1980) An ecological risk index for aquatic pollution control, A sedimentological approach.Water. , Research 14, 975-1001.
- 26.Yang Z, Lu W, Long Y, Boa X, Yang O. (2011) Assessment of heavy metals contamination in urban topsoil from Changchun City. , China.J. Geochem.Explor 108, 27-38.
- 27.Bhutiani R, D B Kulkarni, D R Khanna, Gautam A. (2017) Geochemical distribution and environmental risk assessment of heavy metals in groundwater of an industrial area and its surroundings. , Haridwar, India.Energy, Ecology and Environment 2(2), 155-167.
- 28.O R Ghaleno, M H Sayadi, M R Rezaei. (2015) Potential ecological risk assessment of heavy metals in sediments of water reservoir case study:. , Chah Nimeh of Sistan.Proc InterAcadEcolEnviron Sci 5(4), 89-96.
- 29.Tomlinson D, Wilson J, Harris C, Jeffrey D. (1980) Problems in the assessment of heavy metal levels in estuaries and the formation of a pollution index.HelgolanderMeeresunters. 33, 566-575.
- 31. (2018) Department of Petroleum Resources (DPR). Environmental Guidelines and Standards for the Petroleum Industry in Nigeria. EGASPIN 3rdEd .
- 32.J O Nduka, Aigberua A O. (2018) Heavy Metals and Physicochemical Characteristics of Soils from the Banks of Effluent Wastewater Retention Pits in the Niger Delta. , Nigeria.BiotechnolRes 4(1), 48-53.
- 33.Aigberua A, A O Numbere. (2019) Assessment of Dumpsite Soils in Mangrove Forest at Eagle Island. , Nigeria:, It’s Effect on Potential Bioavailability of Heavy Metals in the Environment.J. Pet. Environ.Biotechnol 10(1), 1-9.
- 34.Aigberua A O, Inengite A K. (2019) Chemical Speciation and Mobility of Heavy Metal (Pb, Cd, Zn, Mn) Pollutants in Crude Oil Contaminated Soils of Niger Delta. , Nigeria, Elixir Appl. Chem 126, 52543-52548.
- 35.Aigberua A O, Okere U V. (2019) The impact of oil spills on prevailing metal-soil associations.International. , Journal of Scientific & Engineering Research 10(5), 1339-1365.
- 36.M I Yahaya, Mohammad S, B K Abdullahi. (2009) Seasonal Variations of Heavy Metals Concentration in Abattoir Dumping Site Soil in Nigeria.J. , Appl. Sci. Environ. Manage 13(4), 9-13.
- 37.S C Izah, S E Bassey, E I Ohimain. (2017) Assessment of heavy metal in cassava mill effluent contaminated soil in a rural community in the Niger Delta region of Nigeria.EC Pharmacology and Toxicology. 4(5), 186-201.
- 38.O A Aghoghovwia, S C Izah, F A Miri. (2018) Environmental risk assessment of heavy metals in sediment of Nun River around Gbarantoru and Tombia Towns. , Bayelsa, State, Nigeria,Biological Evidence 8(3), 21-31.
- 39.Oluwatuyi O E, T F Ajibade, Adelodun B, A S Olowoselu, J R Adewumi et al. (2020) Total concentration, contamination status and distribution of elements in a Nigerian State dumpsites soil.Environmental Sustainability Indicators. 5, 100021.
- 40.G U Chibuike, S C Obiora. (2014) Heavy Metal Polluted Soils:. Effect on Plants and Bioremediation Methods.Applied and Environmental Science, Article ID 752708-12.
- 41.Xie Y, Fan J, Zhu W, Amombo E, Lou Y et al. (2016) . Effect of Heavy Metals Pollution on Soil Microbial Diversity and Bermudagrass Genetic Variation.Front. Plant. Sci 7, 755.
- 42.Yang J, Ma S, Zhou J, Song Y, Li F. (2018) Heavy metal contamination in soils and vegetables and health risk assessment of inhabitants in Daye. , China.Journal of International Medical Research 46(8), 3374-3387.
- 43.Jia Z, Li S, Wang L. (2018) Assessment of soil heavy metals for eco-environment and human health in a rapidly urbanization area of the upper Yangtze Basin.Scientific Reports. 8, 3256.
- 44.Ideriah T J K, F O Harry, H O Stanley, J K Igbara. (2010) Heavy Metal Contamination of Soils and Vegetation around Solid Waste Dumps in Port Harcourt. , Nigeria.J. Appl. Sci. Environ. Manage 14(1), 101-109.
- 45.Aigberua A O, Ogbuta A A, Izah S C. (2020) Selected heavy metals in sediment of Taylor creek due to anthropogenic activities in the Niger Delta region of Nigeria: geochemical spreading and evaluation of environmental risk.Biodiversity. , Int. J 4(2), 67-80.
- 46.S C Izah, S E Bassey, E I Ohimain. (2017) Assessment of pollution load indices of heavy metals in cassava mill effluents contaminated soil: a case study of small-scale cassava processing mills in a rural community of the Niger Delta region of Nigeria.Bioscience Methods. 8(1), 1-17.
Cited by (5)
- 1.Ayobami Aigberua Omozemoje, 2022, An assessment of trace metal pollution indicators in soils around oil well clusters, Petroleum Research, 7(2), 275, 10.1016/j.ptlrs.2021.09.001
- 2.Ologidi Charles Godspower, Tanee Franklin B. G., Agbagwa Ikechukwu O., 2023, Petroleum hydrocarbons reduction by selected tropical grass species in oil-based drill cuttings contaminated soil, International Journal of Phytoremediation, 25(6), 728, 10.1080/15226514.2022.2104808
- 3.Bridget Odochi Ubechu, Iheanyichukwu Opara Alexander, Okechukwu Onyekuru Samuel, Chukwuemeka Ikechukwu Chigozie, Juliana Ofoh Ifeyinwa, et al, 2024, Hydrogeological assessment and contaminant transport modelling of Enyimba landfill site in Aba, Nigeria, Water Practice & Technology, 19(5), 2108, 10.2166/wpt.2024.122
- 4.Izah Sylvester Chibueze, Aigberua Ayobami Omozemoje, 2023, , , 32(), 151, 10.1007/978-981-19-6974-4_6
- 5.Izah Sylvester Chibueze, Aigberua Ayobami Omozemoje, 2020, Microbial and heavy metal hazard analysis of edible tomatoes (Lycopersicon esculentum) in Port Harcourt, Nigeria, Toxicology and Environmental Health Sciences, 12(4), 371, 10.1007/s13530-020-00060-8