
The Brainstem Auditory Evoked Potential: A Reinterpretation of its Electrogenesis
Abstract
Depending upon the species, the brainstem auditory evoked potential (BAEP) consists of four or five major high frequency components. According to longstanding doctrine, each wave represents the sequential activation of successively higher nuclei and tracts from the 8th (auditory) nerve to the midbrain (inferior colliculus). Although this conceptual framework has acquired the status of near dogma, surprisingly little evidence exists in support. In the present analysis, a new interpretation of the electrogenesis of the BAEP is proposed which is simpler although it retains skeletal elements of the older explanation. The revised model is mostly derived from two distinct sources. In the first, the timing of the BAEP waves is compared with that of cortical activity for a range of mammals including humans, monkeys, cats, rats and guinea pigs. It is demonstrated that for each of these, the conduction time of the acoustic signal to the cortex from the putative midbrain component (wave IV or V) is so unrealistically long that it implies that the entire waveform must arise in the peripheral pathways of the auditory system. In the second, a retrospective analysis is made of click repetition rates on the BAEP using extradural electrodes. It was shown that at high rates of stimulation (about 100/sec), the behavior of the waveform is almost totally at variance with the expectations of the conventional model. The essence of the revised conception is that all BAEP waves are just variations of the compound action potential of the 8th nerve, albeit generated or regenerated via separate routes and different methods. Such an explanation would thereby account for their near uniform sharp morphology as well as creating the impression of a composite neuronal response. More specifically, in the case of a four component BAEP, wave I is assumed to be generated by the normal air conduction route in an identical manner to the conventional explanation. In contrast, wave ll is assumed to be generated via bone conduction in the temporal skull thereby bypassing the transduction process in the middle ear. Wave lll is assumed to be generated by the first echo of the bone-conducted sound wave. Likewise, the second rebound within the temporal bone serves as the stimulation to evoke wave lV. As the energy of the auditory stimulus gradually dissipates, it may still continue to generate a train of lower amplitude potentials. It is concluded that the BAEP may contain little or no brainstem or midbrain activity and therefore the term BAEP may be a misnomer. A more appropriate epithet might therefore be the auditory nerve evoked potential or ANEP.
Author Contributions
Academic Editor: Raul Isea, Fundación IDEA, Hoyo de la Puerta, Baruta, Venezuela.
Checked for plagiarism: Yes
Review by: Single-blind
Copyright © 2025 Nigel A Shaw
 This is an open-access article distributed under the terms of the Creative Commons Attribution License, which permits unrestricted use, distribution, and reproduction in any medium, provided the original author and source are credited.
Competing interests
The authors have declared that no competing interests exist.
Citation:
Introduction
The Brainstem auditory evoked potential (BAEP) aka the auditory brainstem response or the brainstem evoked response or brainstem auditory response is one of the major discoveries in the field of clinical neurophysiology in the past half century. The waveform is a far-field potential normally recorded from a surface electrode located at the vertex of the skull or scalp. It consists of a series of high frequency subcomponents or wavelets of positive polarity which purport to originate mostly within the auditory brainstem (Figure1). As such, it represents a near unique means of accessing bona fide neuronal activity from the deepest regions of the brain in a rapid, economical, non-invasive and painless fashion. Further, it has proven largely immune to a range of sedative, anesthetic agents as well as the state of arousal of the subject. In the five decades since its discovery, the BAEP has carved out a useful and sometimes indispensable role not just in assessing auditory function but in many other spheres of biomedicine and psychophysiology. 1, 2, 3, 4, 5, 6, 7, 8, 9, 10, 11, 12, 13, 14, 15
Just some of the more significant applications of the BAEP are outlined as follows:
To determine hearing loss and establish auditory thresholds and acuity especially in younger, handicapped or unresponsive patients for whom standard audiometry may be inappropriate or has failed.
To provide objective evidence when neonatal deafness or other neurological impairment is suspected.
In neurological investigation, to diagnose demyelinating disease such as multiple sclerosis, leukodystrophy and central pontine myelinolysis.
To detect and localize posterior fossa tumors such as acoustic neuroma and cerebellopontine angle lesions.
During certain neurosurgical procedures (such as removal of acoustic neuromas) to constantly monitor the waveform so as to attempt to preserve hearing and other brainstem structures and functions.
To assess the neurological status and particularly brainstem function during states of coma.
To help confirm whether brain death has actually occurred especially when the EEG is isoelectric.
To contribute to the establishment of an early and accurate prognosis for patients comatose after severe traumatic brain injury.
To use as a screening tool for those suffering from sleep apnea or for infants at risk of cot death (sudden infant death syndrome).
In animal research, the BAEP may be utilized to assess the impact of ototoxic and neurotoxic agents on brainstem function.
The BAEP has even been co-opted to explore quasi-paranormal phenomena such as the near- death experience. 16, 17, 18
The BAEP was formally discovered in the early 1970s when Don Jewett and colleagues published a series of papers in which they reported recordings from both humans and animals. 19, 20, 21 It soon attracted a degree of public attention. For example, in the international edition of Newsweek of June 10 1974, there appeared an article entitled “Soundtracks in the brain”. This outlined in colloquial but otherwise quite accurate terms its potential for assessing the psychopathophysiology of the auditory system. This article also mentions the initial contributions of Arnold Starr. Starr, along with Jewett and James Stockard and their associates were three of the pioneers most responsible for defining the electrogenesis and clinical utility of the BAEP.
As with many new scientific ideas or discoveries, deciding who exactly deserves credit can be a somewhat fraught and often controversial matter. The BAEP is not an exception to this rule.4 An argument can readily be mounted that the BAEP was actually discovered 3 yr earlier by an Israeli team.22 They reported an auditory waveform essentially identical to the BAEP except that the wavelets were of negative polarity reflecting the employment of a different electrode montage to the conventional BAEP recording. Sohmer and Feinmesser also proposed an explanation for how individual waveforms might be generated. Although very brief and inchoate, it nonetheless provided the skeleton of the model which is still current. Jewett has written an often wry and anecdotal account of the discovery of the BAEP.23 In this, he generously acknowledges that a number of investigators could legitimately share in the credit.
The BAEP is typically elicited using a click stimulus and up to seven short- latency wavelets are extracted from the background EEG using standard averaging procedures. They are traditionally labelled with Roman numerals. However, only the first four or five wavelets are consistently reproducible and therefore systematically studied and utilized. A significant difference between the human BAEP and many other mammals is that in the former, five major components are recognized, in comparison with just four in the latter (Figure 1). This disparity is sometimes attributed to humans having a somewhat longer acoustic nerve. 24, 25
Figure 1.Three examples of the BAEP. In the upper illustration is a human BAEP with the five principal high frequency waves identified with Roman numerals. Note that in this example, the trace begins 0.5 msec after the stimulus. Two averages are superimposed to demonstrate reproducibility. In the middle illustration is a rat BAEP which like most small mammals consists of just four major waves. In the lower illustration is a second example of a rat BAEP. Note the train of lower amplitude wavelets which follow the principal components. BAEPs were recorded from a vertex electrode referred to an ipsilateral ear following monaural click stimulation delivered at a rate of 10/sec. The higher amplitude rodent waveform was due to the extradural skull screw electrode whereas the human BAEP was recorded using a subdermal needle meaning that the signal strength was much weaker.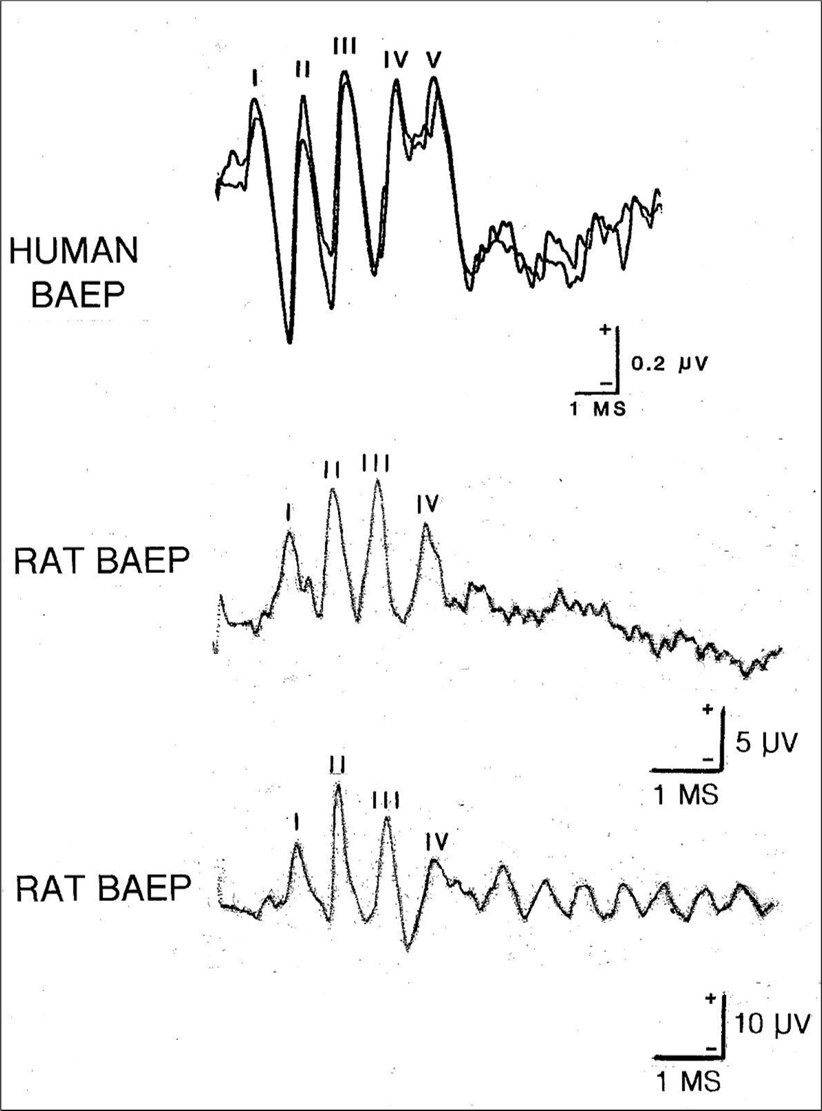
The putative generators of the BAEP components were first adumbrated by Sohmer and Feinmesser, 22 then refined and elaborated by Jewett and Williston 21 and finally given their classic formulation by Stockard and co- workers.26 In a nutshell, the orthodox or standard explanation of how the BAEP waves arise can be summarized as follows: each component reflects the sequential activation of successively higher auditory structures, pathways and nuclei. Thus, as the acoustic signal ascends the central auditory tracts, it generates a series of high frequency wavelets.
More specifically, wave I was considered to be generated in the acoustic (8th) nerve and wave II in or near the cochlear nucleus of the rostral medulla. Wave III arose in or near the superior olivary complex and trapezoid body. Wave IV represented transmission of the auditory signal within the tracts or nuclei of the lateral lemniscus. Wave V was generated by activity in the inferior colliculus at the midbrain. The later less prominent unstable waves VI and VII were thought to reflect activity in the medial geniculate body and auditory radiations, respectively.
This simple initial conception of a discrete one to one correspondence between single localized generators and individual BAEP waves has long been abandoned although it may still be employed in the interpretation of routine clinical recordings. Instead, a particular BAEP wavelet is now conceived as being a complex amalgam of activity from multiple sources with overlapping contributions or inputs from ipsilateral, contralateral and bilateral tracts and waystations. 2, 4, 9, 13, 24, 27, 28, 29, 30, 31 The one exception to this principle is that of wave I. There is unanimity that its origin is the compound action potential (CAP) propagated in the 8th nerve because it coincides precisely with the N1 component of the electrocochleogram (ECochG) and has an identical sharply- defined morphology. 4, 13, 21, 24, 32, 33 The ECochG is recorded in or near the round window and its N1 component arises in the acoustic nerve.
Apart from the above modifications, however, Stockard’s prototype has remained fundamentally unchanged for more than 40 yr. At least part of the reason for its longevity may be an absence of any rival explanation. The popularity and resilience of the model is exemplified by its entry in Wikipedia as well as numerous YouTube videos. As part of the present investigation, 23 textbooks in the fields of neurology and audiology all published in the 21st century were consulted. 4, 5, 6, 7, 8, 9, 10, 12, 13, 15, 31, 34, 35, 36, 37, 38, 39, 40, 41, 42, 43, 44, 45 Without exception, all of these subscribed to the basic paradigm outlined above. Not one expressed any uncertainty nor made heretical comment. Despite this overwhelming expression of confidence and the prolific number of research publications involving both animal experimentation and clinico-pathological studies in patients, this longstanding explanation still has only qualified substantiation and in some respects borders on being a dogma.
Because of the range of activities which the BAEP is involved in and their frequent clinical value, it is imperative to get an accurate grasp of exactly what the waveform is a measure of. In the current review, the conventional model of BAEP generation is challenged by two quite separate groups of data in order to test its viability and integrity. This explanation will now subsequently be referred to by the abbreviation OMOBG (the original model of BAEP generation).
The Timing of the BAEP Wavelets in Relation to Cortical Activity
The purpose of the first trial was to compare the timing of the BAEP components, whose origins remain mostly uncertain, with that of an auditory potential whose origin is known with certainty. It was anticipated that by studying the relationship between a well-established temporal milestone and the BAEP, this might provide insights into the generation of the latter. This analysis is basically an adaptation and condensation of a more extensive article which examined the functional organization of the auditory system.46
The neuroelectric activity chosen to compare with that of the BAEP was the primary cortical auditory evoked potential (PCAEP). This is the post-synaptic response generated by the initial arrival of the acoustic signal in the primary auditory reception center of the temporal cortex (P1). As such, it provides the conduction time (CT) for the afferent volley to traverse the length of the specific auditory pathway from ear to cortex. The value for P1 has been definitively established for a variety of mammals including humans. In most such animals, the primary auditory cortex (PAC) lies on the surface of the temporal lobe and therefore the PCAEP is readily accessible. Unfortunately, in humans, the PAC is located in the transverse temporal gyrus (Heschl’s gyrus) which is buried in the Sylvian fissure and so is inaccessible with a surface recording. Nevertheless, The PCAEP can be obtained with an intracranial electrode during neurosurgical procedures.
The OMOBG claims that the inferior colliculus is the reputed generator of wave V in humans. It would therefore be predicted that if the CT from the midbrain to cortex was added onto the peak latency of wave V, then this value should coincide closely with that of P1. Calculating CT with precision within segments of central sensory pathways is an uncertain exercise but an approximate value can be obtained. Conduction velocities (CVs) in central sensory tracts vary widely from 10-130 m/sec 47 so a conservative speed of 50 m/sec would seem appropriate. Length of pathways between midbrain and cortex should be no more than 10 cm and so CT within them would be estimated at no more than 2 msec. There are two synaptic delays interposed in this pathway which each should contribute 0.5 msec.47 An extra 1 msec might be added to compensate for any erroneous suppositions or premises. Based upon these assumptions, CT between the inferior colliculus and the PAC would be calculated to be in the order of 4 msec.
The results of this analysis of CT within the more rostral parts of the central auditory pathway have been summarized in Figure 2. Depending upon the idea that wave V arises in the midbrain, it can be deduced that the arrival time of the auditory signal at the cortex (P1) would be approximately 10 msec. However, this predicted value is much shorter than the actual arrival time of about 16 msec. 48, 49, 50 This means that the CT of about 10 msec between wave V and P1 is about 2.5 times longer than the estimated CT between the inferior colliculus and the auditory cortex. It would be near impossible to otherwise account for such a long CT between these two auditory centers.
Figure 2.Schematic waveforms demonstrating the temporal relationship between the BAEP and the PCAEP in humans. The illustration on the left shows the PCAEP which would be predicted to occur based upon the assumption that wave V arises in the midbrain. Under these circumstances, the auditory signal is estimated to arrive at the primary auditory cortex ( P1 ) at approximately 10 msec. The illustration on the right shows the real temporal relationship between the BAEP and the PCAEP where the value of P1 is 16 msec. Note that the actual conduction time from wave V to P1 is therefore 2.5 times longer than the predicted conduction time.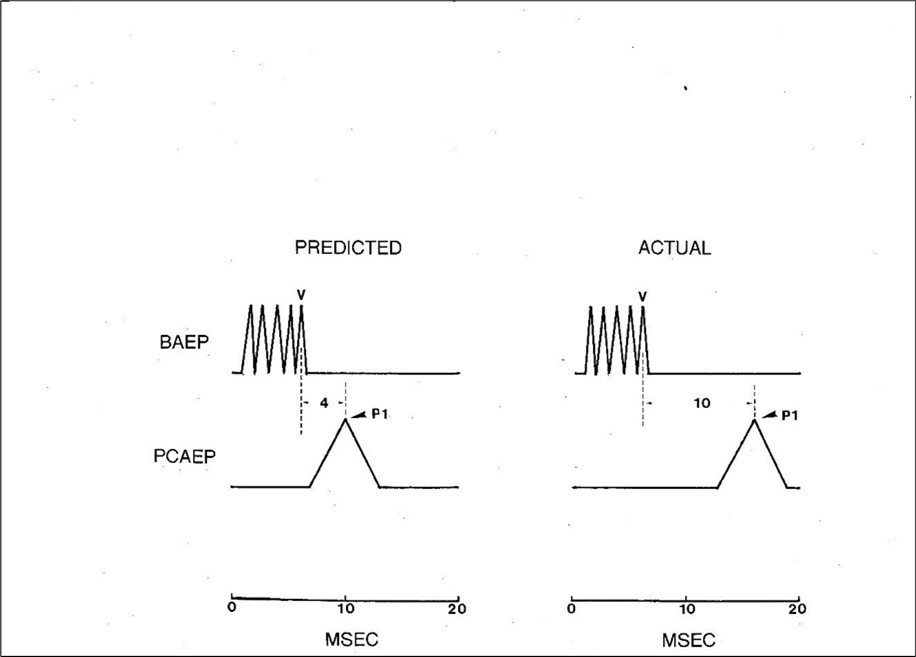
The only way of reconciling such discrepant findings is to assume that not just the generators of the early BAEP waves (I and II) but also the later ones ( III and IV) are all packed tightly into the peripheral subdivision of the auditory pathways. This implies that BAEP wave V, far from arising in the midbrain, must have an origin in close proximity to the 8th nerve. This is the only means of making the peak latency of wave V compatible with the timing of the PCAEP. Such a conclusion therefore offers little or no support to the long-established sequential activation conception of BAEP generation.
There is nothing especially exceptional about such a long wave V – PCAEP CT in humans. The same calculation can also be made for a variety of mammals with essentially the same findings. For example, the CT between wave IV (equivalent to wave V in humans) and P1 of the PCAEP in the monkey is about 8 msec. 51, 52 For the cat, it is about 9 msec.53, 54 For the rat, it is about 5 msec. 55, 56 For the guinea pig, it is about 6 msec. 57, 58 All these values are far in excess of what might be expected if wave IV genuinely arose in the nuclei of the inferior colliculus. This reinforces the suspicion that even the last of the major BAEP waves must be generated in a very caudal position within the auditory pathways.
While this is not a common view, neither is it totally heretical nor without precedent. For example, Ragi 59 also concluded that the BAEP most likely originated in a very restricted area of the peripheral auditory system with no brainstem contribution. In this instance, it was argued that the waveform represented summated oscillatory activity arising exclusively in the cochlear hair cells.
The Effects of Stimulus Repetition Rate on the BAEP
For its second trial, the BAEP was subjected to a type of stress test. This involved recording the waveform at increasingly high rates of stimulation and observing the behavior of the individual wavelets under such conditions. The purpose was two-fold. First, to supplement the conclusions of the first trial regarding the site of generation of the BAEP and so help to confirm how unsatisfactory the OMOBG really is. Second, to determine whether any modifications in the waveform as click rate increased provided insights into its actual mechanism of action.
There have been numerous studies of the effects of repetition rate on the BAEP using both human and animal subjects. They are among the most common experiments in BAEP research. Summaries of this frequently conflicting and confusing data are available. 2, 4, 9 Among the chief problems interpreting such material is the difficulty in accurately recognizing poorly - defined responses at higher rates.
The motives for conducting what might at face value appear quite perfunctory even pedestrian research are several. First, it can define the optimal rate for clinical recordings which is important considering the large number of responses usually needed to be averaged to extract the minute volume- conducted responses. Second, recording at high rates stresses the auditory system and therefore may reveal more subtle abnormalities not obvious at slower rates.13 Third, such experiments may provide insights into the electrogenesis of the BAEP.
In the case of the OMOBG, the expectation would be that as the rate rises, the latencies of the individual peaks should progressively increase whereas their amplitudes should systematically decline. This prediction is largely based upon the assumption that there is one synaptic junction interposed between the generators of each successive wave. 23, 60 The deterioration in waveform morphology therefore presumably reflects the cumulative impact of impaired synaptic efficiency as the frequency of the afferent volleys increases. This also implies that the earlier waveforms should be less altered than the later ones and proportionately greater for the later ones (Figure 3, lower left illustration).
The data to be reviewed on how click rates modify the BAEP waveform was originally reported by Shaw.61 It was derived from rats moderately anesthetized with pentobarbital. BAEPs were recorded from extradural skull screw electrodes which allowed well-defined responses to be obtained with only a limited number of neuroelectric traces needed to be averaged. BAEPs were recorded at 21 different repetition rates ranging from 1 – 100/sec.
Because of the anomalistic and paradoxical nature of the findings, the actual BAEP tracings were illustrated for several subjects. This was to demonstrate how consistent and reproducible the changes in waveform discovered were across all subjects. It should also be kept in mind that this section deals with the rodent BAEP and so just four major wavelets are considered.
The results of this investigation are displayed in schematic fashion in Figure 3 (lower right illustration) and contrasted with what might otherwise have been expected. If the tenets of the OMOBG are correct, then a waveform recorded at high click rates should possess characteristics similar to the artificial waveform shown in the lower left illustration. The logic for these suppositions was discussed above. More specifically, there should be a progressive reduction in amplitudes and corresponding prolongation in latencies, the extent of which is more pronounced in the later waves.
Figure 3.Three artificial BAEPs illustrating how the waveform might possibly behave as stimulus rate is increased. The lower left example shows the configuration which would be expected according to the standard model of BAEP generation. In contrast, the lower right example summarizes the observed effects of a high stimulus rate on the waveform. Note that these are representative and schematic waveforms designed to display certain trends and changes but are not themselves derived directly from any data.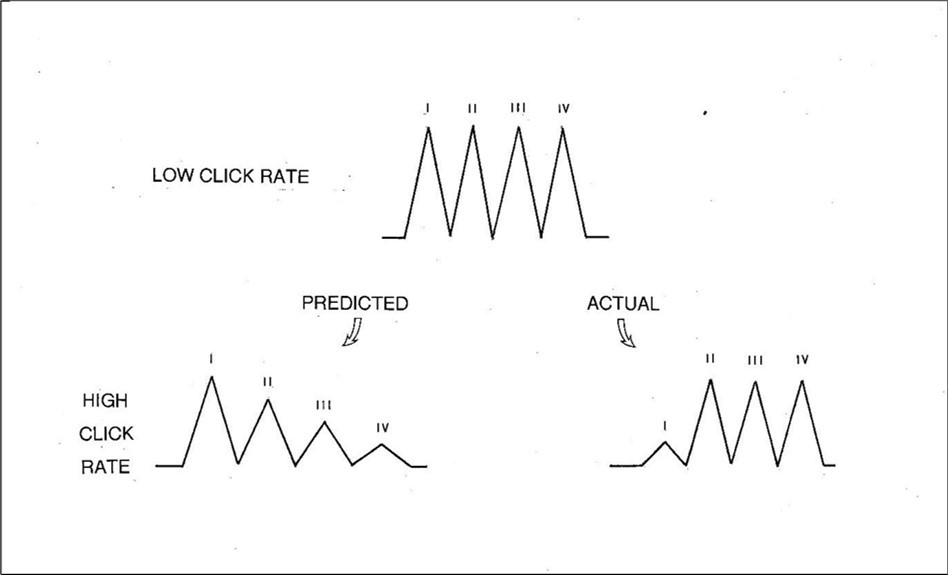
In the lower right illustration is a simulated waveform which synthesizes most of the actual findings at high rates of click stimulation. There was a small near- uniform increase in latency common to wavelets II, III and IV. Unlike the later three waves, the peak latency of wave I was often difficult to identify accurately at such high rates. This most likely explains why the increase in wavelet I appeared slightly less than that for the later ones. Overall, however, there was little or no evidence for the anticipated additive effect on the later waves.
All four BAEP wavelets decreased in amplitude at high stimulus rates but not in the manner predicted by the OMOBG. At the highest click rate studied, waves II, III and IV were invariably and clearly present. They exhibited only a modest decrement, but this was constant across all three waves with no progressive loss which is congruent with the latency data. Likewise, there was no indication of a cumulative effect. In other words, waves II, III and IV all reacted to the increase in click rate from 1-100/sec with a near identical increase in latency (about 0.3 msec) and a near identical loss of amplitude.
In stark contrast, wave I amplitude was drastically reduced at high rates. In some cases, the wavelet essentially disappeared leaving only a stump. Such findings appear extraordinary and are quite the opposite of what might otherwise have been expected. This is also the reason why the latency data for wave I at high stimulation rates must be considered unreliable.
In summary, almost all the modifications to the BAEP waveform at high click rates were contrary to the expectations of the OMOBG, to a greater or lesser extent. This is graphically illustrated by the predicted and actual findings summarized in Figure 3 and how little resemblance they bear to each other with respect to latency, amplitude or overall waveform morphology. These artificial waveforms are complemented by the five pairs of real BAEP traces recorded at low and high click rates shown in Figure 4. Individually, these sets of BAEP recordings all show the same changes, trends and modifications as in Figure 3. None of this scrutiny therefore inspires confidence in the conventional understanding of the generation of the BAEP. Along with the findings on the timing of the BAEP wavelets, it suggests that the standard explanation of its electrogenesis is, at the least, unsound.
Figure 4.Five examples of the effects of low ( about 10/sec ) and high ( about 100/sec ) stimulus rates on the rat BAEP. Note that at a high click rate, wave I is markedly and invariably attenuated and sometimes difficult to identify at all. In contrast, the later waves ( II, III, and IV ) are all clearly present with little or no evidence of any cumulative impact on either latency or amplitude.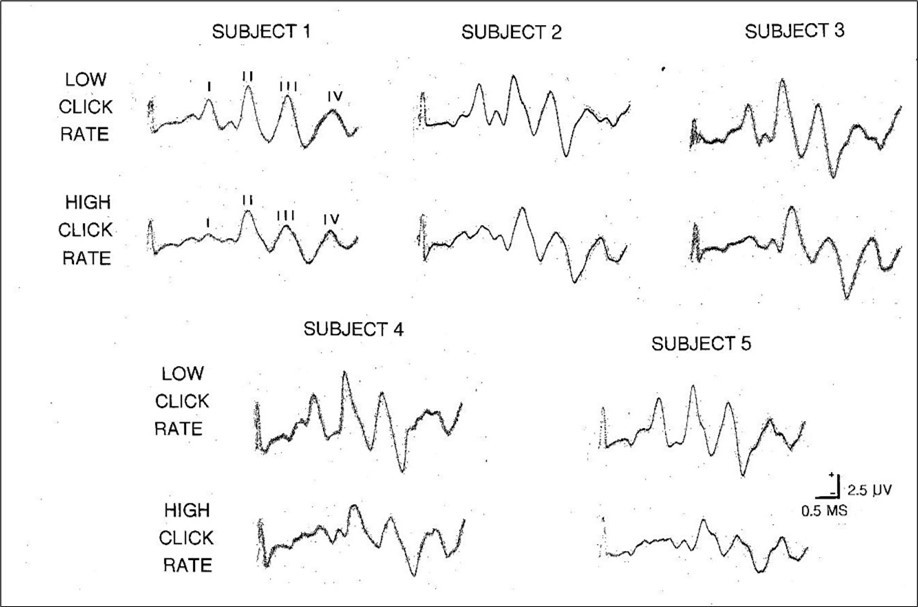
A Revised Model of BAEP Generation
The review of the BAEP conducted so far has identified three characteristics of the waveform not commonly or previously acknowledged. Further, the OMOBG does not cope easily with any of them. If a revised and more tenable model of BAEP generation is to be constructed, it must therefore accommodate and be compatible with all the following features or discrepancies.
The longstanding theory that the BAEP represents activity in successively higher auditory structures appears to be mistaken and should be abandoned or modified. The test on the timing of BAEP wavelets makes it clear that all these components must be assumed to be generated in or near the vestibulocochlear nerve.
The BAEP is not a homogenous response but rather a composite stemming from more than one type or sub-type of generating system. In particular, wave I has an origin which differs in important ways from the later components. This is known because of the differential effects of high stimulation rates on the early and later wavelets. Wave I virtually disappears whereas the later waves (II, III and IV) are all still preserved. This must mean that there is no direct relationship between the generation of wave I and the subsequent waves. Otherwise, the loss of amplitude in wave I would have been transferred onto them as well. Rather, waves II, III and IV must arise via an alternative route which is at least partially separate from that of wave I.
Further inferences can also be made about the electrogenesis of waves II, III and IV. These components responded in a near identical manner to higher rates of stimulation showing approximately the same increment in latency and decrement in amplitude across all three waves. This pattern is not what would be anticipated if the waves were linked in a dependent fashion where there would be evidence of a gradual accumulative effect operating for both latencies and amplitudes. Rather, such findings suggest that waves II III and IV are a sequence of potentials which are independently generated of each other although they may share a common site and mechanism of action.
Enough information is now available to synthesize an updated and simplified version of BAEP generation. This should overcome some of the weaknesses, shortcomings and paradoxes inherent in the OMOBG by incorporating the contemporary insights presently discussed while retaining certain elements from the current model.
The basic tenets of the modified version of BAEP generation (MVOBG) are illustrated in the schematic diagram in Figure 5. The fundamental principle underlying the proposed model is that it is the events which transpire between the click stimulation and the arrival of the sound wave at the cochlea which are the key to understanding the origin of the BAEP waves. However, this new version retains one important element from the OMOBG. This is the site and mode of generation of wave I.
Figure 5.A schematic and simplified summary of the main features of the revised model of BAEP generation. According to this, each click elicits four separate sound waves which sequentially stimulate the cochlea. One of these is transmitted via the conventional air conduction route in the external auditory meatus. The remaining three are propagated via bone conduction in the temporal skull. Each, in turn, ultimately generates a compound action potential in the 8th nerve. Collectively, this successive activity creates the distinctive high frequency BAEP waveform.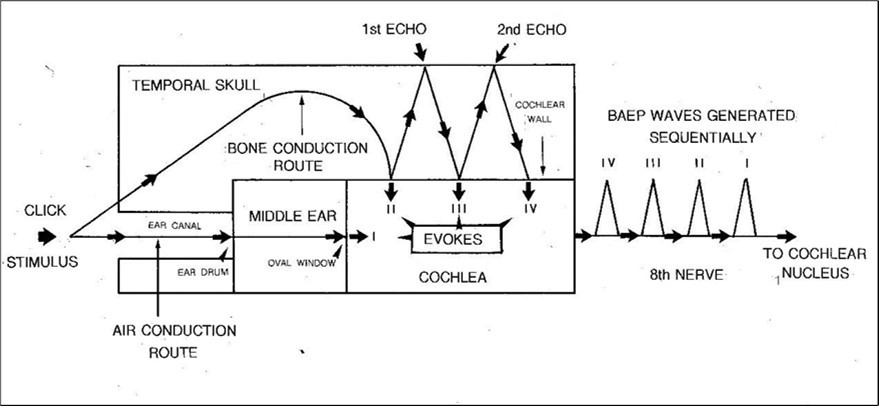
Generation of Wave I
According to the OMOBG, wave I is generated by acoustic energy transmitted in the normal functional pathway of the auditory system. Air pressure waves elicited by the sound of the click stimulus are channeled through the external auditory meatus to the tympanic membrane ( TM ). Here, the three ossicular bones of the middle ear convert the air vibrations to mechanical ones and their leveraging properties in combination with the size of the oval window greatly amplify the acoustic signal probably in the order of 20 times. The impact of the stapes bone at the oval window converts sound energy into hydromechanical vibratory pressure waves which are transmitted through the cochlear lymph fluids in the scala vestibuli and scala tympani. This activity ultimately creates a travelling wave which is propagated along the basilar membrane. Throughout the length of the basilar membrane are mounted the hair cells of the organ of Corti. It is the interaction between the vibratory motion of the basilar membrane, the hair cells (hearing receptors essentially acting as mechanoreceptors and frequency resonators) and the tectorial membrane hovering over them which is the primary transduction process underlying sound perception and pitch analysis. Stimulation of the hair cells via bending of their stereocilia initiates neuroelectric potentials in the organ of Corti. The organ of Corti is innervated by the first- order sensory neurons of the vestibulocochlear (8th) nerve and depolarization of these fibers gives rise to the afferent volley and CAP which may be variously recorded as BAEP wave I or ECochG component N1.
Generation Of Wave II
According to the OMOBG, wave II is the first of the actual brainstem components of the BAEP. A source in the medulla at about the level of the cochlear nucleus is usually mooted. Instead, the MVOBG also locates the origin of wave II in the 8th nerve. It is therefore contended that it is essentially the same response as wave I albeit being generated via an alternative and overall slightly slower route. This creates the impression that wave II is a separate response masquerading as a genuine brainstem response. The only real difference between waves I and II is that while wave I is generated via the conventional air conduction (AC) route in the external auditory canal, wave II is generated via skull vibrations transmitted to the cochlea via bone conduction (BC) in the temporal skull as well as through skin, cartilage, fluids and brain tissue. 4, 5, 15, 36 In reality, the passage of the sound wave by-passes the middle ear and is therefore not interrupted by the amplifying apparatus at work within the ossicular chain of bones. The interface between the temporal bone and the cochlea is, in effect, acting as functionally equivalent to that of the ossicular machinery operating in the middle ear on the oval window membrane. However, any such compensatory mechanism is probably redundant in BC where vibrations in the skull do not lose their energy in comparison with a weakly conducting medium such as air.
The arrival of the BC signal at the cochlea triggers alternating compressional and distensible distortions in the molecular structure of the bony wall which initiates pressure waves in the cochlear fluid. These disturbances, fluctuations and displacements in the various lymph-filled cavities of the cochlea eventually set in motion vibratory movements in the basilar membrane in a similar manner to that which occurs in conventional AC sound propagation.4,9,41,62 At this stage in the hearing process, BC and AC pathways have joined in what Dauman62 labels “the final common pathway”. Assuming the preceding analysis is correct, it would therefore be expected that a second BAEP wave also arising in the 8th nerve should be generated in close temporal proximity to wave I.
Generation of Waves III and IV
Waves III and IV are conceived of as having an almost common origin and so will be dealt with as a pair. The key concept when considering their generation is that of the echo or rebound of the BC sound waves. When a vibratory signal initially strikes the cochlear wall, it not only distorts its molecular structure but also bounces backward until it collides with a hard bony surface nearby capable of successfully reflecting the sound wave back (as an echo) to the skull-cochlear barrier. It is therefore contended that it is this second- hand sound that provides the stimulation to elicit wave III. The site and mechanism of generation is otherwise understood to be identical to that of wave II.
A second echo provides the third hand stimulus to evoke wave IV, again via the mode of action for waves II and III. The auditory signal may continue bouncing back and forth until its energy is dissipated. This may create a string of minor oscillatory-like potentials in the latter part of the waveform after the termination of the principal components. Such a phenomenon is frequently observed (Figure1, bottom example). It may also provide a simpler and more logical explanation for the mysterious waves VI and VII in the human BAEP. An origin in the rostral part of the central auditory pathways was never very satisfactory. It would be hard to account for such relatively diminutive responses if only because the recording electrode is so close to its putative generators.
In summary, the MVOBG proposes that all four (or five) major components of the BAEP have a common origin in the 8th nerve. This accounts for their uniformly sharp morphology and rhythmic appearance. More specifically, wave I is generated via the AC pathway while Waves II, III and IV are generated via the BC route. Further, individual waves are not physiologically linked to each other but rather are independently generated via direct stimulation by the sound wave. A combination of sound wave rebounds within the temporal bone, dissimilar transduction processes and variable speed of sound depending upon the medium probably account for their temporal separation.
The Role of the Petrous Bone
The MVOBG demands a nearby location or surface capable of reflecting auditory signals back and forth so as to continually re-energize the cochlea. The most obvious candidate for this role is the petrous bone itself. This structure is the component of the temporal bone which houses the apparatus for hearing and balance. Further, its compact and hard composition in combination with its labyrinthine architecture makes it an ideal milieu for the conductance and reflection of sound waves. The petrous bone is therefore conceived as a type of de facto echo chamber to restimulate the cochlea. In fact, the petrous bone is replete with anatomical landmarks, structures, boundaries and surfaces which could create a state of acoustic impedance mismatch ( AIM ) and therefore serve as a reflection site or rebound mechanism. 63 These include interfaces, sutures, ridges, vestibules, curvatures, plates, grooves and cavities. In addition, the bone is honeycombed with sundry rocky canals, tunnels, or channels. Some of the main sites where an AIM might arise within the petrous bone are summarized in Figure 6.
Figure 6.A schematic diagram highlighting some of the anatomical landmarks, structures and boundaries within the petrous bone from which bone- conducted signals might rebound and therefore be diverted or re-directed back towards the cochlea.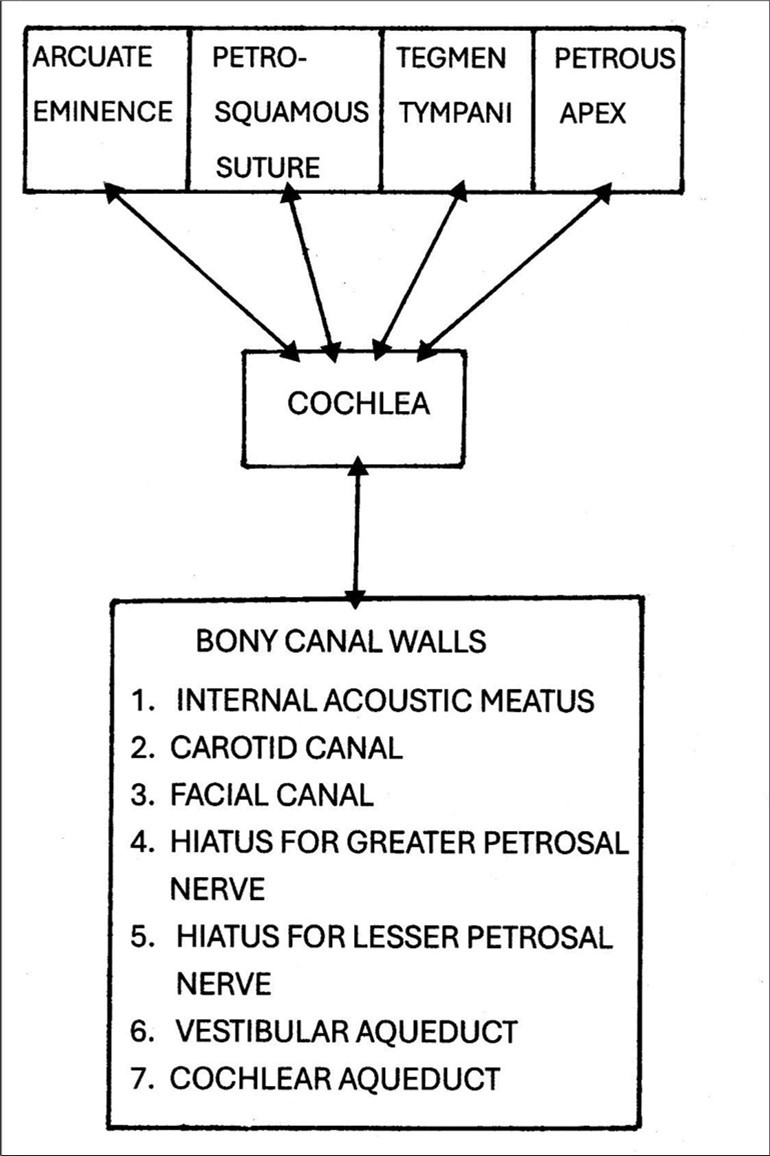
The petrous bone in an adult human has a volume of little more than 5 cm3 . This restricted space implies limited or largely fixed signal transmission times within the bone. This further suggests that internally generated rebounds from diverse sources may coincidentally and fortuitously summate to reinforce one another and so enhance the strength of a secondary stimulus or echo.
It is clear from this survey that there exists no shortage of arrangements within the petrous bone which could play a role in the continuing bombardment of the cochlea beyond the initial stimulation. It is also remarkable that the petrous bone is virtually unique among cranial bones to the extent in which it is punctured with bony channels.
Evidence for the Revised Model
Previously, three characteristics of the BAEP were identified which seemed at variance with the OMOBG. The revised model outlined above was designed in an attempt to overcome these difficulties. In this section, the success of the MVOBG in dealing with the three problems will be examined.
According to the OMOBG, the BAEP waves reflected sequential activation from the 8th nerve to the midbrain. Such an assumption gives rise to quite unrealistic estimates of CTs within segments of the central auditory pathway. In contrast, the MVOBG locates all the BAEP waves quite discretely in the acoustic nerve. The advantage now is that it is much easier to reconcile the timing of the BAEP waves with the arrival of the sensory signal at the auditory cortex.
Even more inexplicable than the apparent temporal relationships between potentials presumed to arise at different levels within the hearing pathway was the differential reactions of individual BAEP waves as click rate increased. At high rates, the first wave could barely be recognized but the later three remained very well-defined. It is nearly impossible to account for this strange pattern of loss and preservation with the OMOBG. However, it can be readily explained by a hybrid AC – BC paradigm as incorporated into the MVOBG. According to this, the reason why wave I is so drastically affected is because it is the only one of the wavelets actually generated via AC in the external auditory meatus. While this is normally a very proficient and reliable route, at higher rates the gearing mechanism in the middle ear cannot cope and simply seizes up thereby impairing or completely obstructing sound wave transmission and transduction. This prevents, or at least disrupts, the generation of wave I except in a very residual or attenuated state. Because waves II, III and IV remain more or less intact even at high rates of stimulation, this is evidence that all three must be generated via the alternate roundabout route in the temporal skull. This means they largely evade the sabotage and degradation sustained by wave I. Unlike the intricate but delicate apparatus operating in the middle ear, the rudimentary but serviceable physical processes must allow vibratory energy to pierce the temporal wall and enter the cochlea even at high rates of stimulation. This activity therefore survives to evoke waves II, III and IV with comparatively minor distortions in amplitude or latency.
By examining the effects of stimulus rate on the BAEP, it was possible to demonstrate that the potential was a composite waveform with the early element (wave I) being evoked by one sound pathway and the later elements (waves II, III and IV) by a quite separate route. With a more detailed examination of the effects of stimulus rate on these later waves, it was also possible to infer something about their individual generation. According to the OMOBG, each BAEP wave is separated by a short axonal tract and one synapse. 23, 60 This means that as the stimulus rate is increased, the accumulative effects of the synaptic delays should steadily mount up and result in progressively longer latencies and smaller amplitudes. As discussed previously, this is not at all what was observed. A central tenet of the OMOBG therefore seems discredited. Instead, it was concluded that each wave (i.e. II, III and IV) is directly elicited by the same auditory stimulus and each arises in the same location (8th nerve) but they are otherwise quite separate and independent responses. The most obvious means by which this course of action could be achieved is by assuming that the original sound wave must continue to be bounced to and from within the boundaries of the temporal bone as an echo. This is the most viable explanation for how the original sound could continue to evoke new (i.e. repetitive) auditory potentials. While this arrangement for supplying a new (later) version of an old (original) stimulus remains suppositional and tentative, it is nonetheless consistent with the near identical findings of stimulus rate increases in waves II, III and IV.
If waves II III and IV are all generated from discharges in the 8th nerve following sequential independent stimulation of the cochlear wall, then the question arises as to the source of their near uniform but relatively modest impairment at high click rates. There are at least three suspects.64 One possibility is that they are all caused by a peripheral adaptation process presumably operating in the sensory receptor. 65, 66 A second possibility is that the changes reflect the refractory period following depolarization of the neuron. The time for an axonal membrane to repolarize following passage of an action potential is not fixed, rather it is a function of fiber thickness.47 The fibers comprising the mammalian auditory nerve do not seem excessively well – myelinated. Widths of no more than about 5 µm appear typical. 4, 31, 67 Nevertheless, for calculations a standard refractory period of just 1 – 2 msec was assumed.64 At 100/sec the interstimulus interval is therefore 10 msec. It follows that the limitations imposed by refractoriness were unlikely to be responsible for any abnormalities in the waveform even up to click rates as rapid as 100/sec. The complication here is that if the MVOBG is accepted, then the highest de facto stimulus rate is at least 400/sec. This is because each click is presumed to bombard the cochlea multiple times via different avenues.
The most plausible explanation for the behavior of waves II, III and IV at high stimulus rates is probably that the modifications to them reflect some kind of impairment of synaptic transmission at the relay between the hair cells at the organ of Corti and the acoustic nerve. Hence, the common designation of rapid stimulus presentation rates as potential synaptic stressors.68 High rates of stimulation will rapidly exhaust the reserves of the excitatory neurotransmitter, in this case glutamate, before the vesicles can be replenished via recycling. The fact that the impact on the amplitudes and more especially the latencies is so limited might be due to the re-uptake mechanism for glutamate being so proficient at conveying molecules back to their pre- synaptic storage.69 Such a process of synaptic fatigue could lead to randomized desynchronized firing among the fibers of the auditory nerve. Predictably, this should produce temporal dispersion of the afferent signals and consequently an overall degradation and reduction in amplitude.64 Whether such a simple mode of action can also account for the minuscule latency increases is uncertain, but it is logical to assume they might when considering they were so slight ( less than one third of a msec ).
It would be further predicted that the gross impairment of wave I at high click rates was the product of a major mechanical breakdown in the middle ear and a lesser malfunction elsewhere in the peripheral hearing system. More specifically, it was argued that the primary contribution is the increasingly faltering performance of the ossicular machinery in the transducing and amplifying of the sound wave. In contrast, the minor contribution is less certain but potentially involves functional disturbances such as adaptation in the sensory receptor, refractoriness and synaptic fatigue.
Challenges to the Revised Theory
The Conflicting Findings with Stimulus Rate Studies
The MVOBG has been largely crafted from the findings of click repetition rates on waveform morphology. As discussed previously, there are a large number of such studies using both animals and human subjects. Most of these are more or less compatible with OMOBG characterized by an uncomplicated trend of increasing latencies and decreased amplitudes. 68, 70, 71, 72, 73 There are, however, occasional discordant results. For example, Hall 4 reiterates how latencies increase and amplitudes decline as a function of stimulus presentation rates.
But he also describes how the amplitude of the later waves is much less vulnerable at high rates (90/sec) than that of wave I. This would seem at least partially supportive of the MVOBG. Unfortunately, Hall provides no reference for this description. It is therefore uncertain whether it represents actual data or some sort of meta – analysis. An illustration provided is not especially edifying.
Far more common, however, are the findings of Church and co-workers.74 They reported that latencies of all waves increased in a cumulative manner while their amplitudes fell more or less uniformly as click rate increased. This research is worth examining because of all the relevant studies, it is probably the one which is most relevant to Shaw.61 Both employed anesthetized rats and recorded BAEPs over a roughly similar stimulus frequency range yet reported quite discrepant effects on the waveform although the findings do overlap to some degree.
One significant difference in methodology between these two studies lies in the nature of the vertex electrode. Church utilized a sub- dermal needle electrode whereas Shaw recorded potentials directly from the surface of the brain with an extra-dural skull screw. Comparisons between the integrity and quality of the waveforms are also difficult because Church provides just three such BAEP tracings compared to 40 in Shaw. Nevertheless, the quality of the recorded signals with the skull screw electrodes seems much superior to those obtained with a sub-dermal needle. The former has a smooth, homogeneous and regular appearance somewhat lacking in the illustrations provided by Church. This means that individual components can be much more clearly and confidently identified, especially when the waveform is being stressed. At this stage, it would seem that a principal reason why the pattern of change observed by Shaw has not been commonly replicated is because of the inferior quality of the recordings particularly at higher rates. It is notable that the great majority of such studies have employed scalp electrodes of some type.
The Relevance and Limitations of Animal research
Evidence for the OMOBG relies heavily on experimental animal studies and clinico-pathological investigations in patients with neurological disorders. Animal research typically involves transection, lesioning and intracranial depth recordings. These are relatively blunt instruments especially considering the subjects are typically smaller mammals. The restricted and confined space of the auditory brainstem in these animals means that neurophysiological findings can be readily confounded or misinterpreted using such techniques. 75, 76
Achor and Starr 30 have catalogued in some detail the difficulties and limitations of conducting and interpreting such lesion or ablation studies. Among these is the inter-animal variability in the size and shape of tissue destruction. Also, there is the possibility that lesioning induces secondary ischemic damage some distance from the actual lesion site.77 Depth recordings of bioelectric activity can be unreliable because high amplitude intracranial potentials are not necessarily reflected in surface recordings. In addition, local adverse extracellular electrical current (EEC) flows may prevent activity being recorded even though the electrode is in close physical proximity to the generator.77 Conversely the BAEP, irrespective of its exact electrogenesis, has very powerful far- field properties. This means that an intracranial electrode located in the brainstem may pick up a signal even though it is being generated some distance away.
All the above considerations must limit the value of such animal research in elucidating the origins of the BAEP components. What can also be said with some confidence is that experimental lesions and depth recordings are probably of doubtful utility when deciding between rival explanations of the electrogenesis of the BAEP. Chiappa 76 skeptically claimed that they contributed little information not available from clinico-pathological studies in which abnormalities in the waveform are correlated with neurological lesions.
As alluded to previously, one of the most comprehensive attempts to define the generators of the BAEP using experimental lesions was conducted by Achor and Starr.30 Discrete lesions were sited in the cat auditory brainstem ranging from the cochlear nucleus up to the inferior colliculus. Both acute and chronic preparations were employed. The effects on the individual components were complex and surprisingly limited. The most prominent finding was a slight change in amplitude especially of the later waves. Otherwise, ablation of many nuclei and tracts produced no detectable effect on the major waves at all. Only after the 8th nerve had been effectively destroyed was there any profound impression on the waveform with the virtual abolition of its components. This rather confusing pattern would appear to offer only weak support for the OMOBG. It would otherwise have predicted a much more deleterious impact on the BAEP of the brainstem lesions than was, in reality, observed. In fact, the scope and range of the BAEP abnormalities reported by Achor and Starr are much more consistent with the MVOBG.
Be that as it may, the correspondence between the expectations of the MVOBG and what Achor and Starr actually found is only very rough. If all the waves do emanate from the 8th nerve, it is hard to understand why ablation of brainstem tissue should result in any change in waveform at all. The components should all remain essentially unscathed. The residual question is therefore what could be the origin of the post – lesion BAEP modifications reported in this study. One possible culprit might be the barbiturate anesthesia employed during the acute experiments. This notion was dismissed as implausible by the authors who believed that the BAEP was largely immune to such pharmacological agents. Nevertheless, it has been demonstrated that even a standard surgical dose of a barbiturate anesthetic can alter the BAEP in significant ways. 53, 78, 79 For example, Shaw 79 demonstrated how all four BAEP waves in the rat showed slight variations and fluctuations in amplitude during an extended state of pentobarbital anesthesia. These minor changes were often accompanied by more gross changes in the morphology and behavior of the last major wave (IV). Such findings would seem to overlap to an extent with the abnormalities reported in the lesioned cats. This implies that an anesthetic contribution to the post-lesioned BAEP cannot be entirely ruled out.
Further evidence that the lesion data presented by Achor and Starr could have been contaminated by the barbiturate anesthetic comes directly from their own findings. Acute lesions in the inferior colliculus and lateral lemniscus resulted in waveform deficits which were not replicated in later chronic recordings. The authors described these findings as “most puzzling” and could provide no ready explanation for the apparently ephemeral effect of the lesions on the BAEP. However, it should also be taken into account that the acute recordings were made under a surgical level of anesthesia while the chronic recordings were obtained while the animals were awake. This type of consideration helps reinforce the belief that the immediate post-lesion alterations in the BAEP could have been due simply to concurrent anesthesia.
Still, it is doubtful if the whole gamut of waveform changes found by Achor and Starr could be attributed solely to anesthetic protocols. In this case, an alternative source of waveform impairment could have been experimental neurosurgical procedures used to create the lesions. These may have caused temporary interference or disruption within the normal EEC flows. Presumably, these would have been restored to normal by the time the chronic recordings were made.
The Relationship Between the ECochG and the BAEP
A potentially serious flaw in the MVOBG concerns the ECochG and its relationship with the BAEP. As discussed earlier, the ECochG is a compound potential consisting of activity from the cochlea and the auditory nerve. 80, 81 The cochlea portion is in turn subdivided into the cochlear microphonic reflecting activity from the outer hair cells and the summating potential generated mostly in the inner hair cells. As such, its origins are probably established with more assurance than those of the BAEP.
The ECochG can be recorded from a variety of locations which may be divided into invasive transtympanic (TT) and non-invasive extratympanic (ET) sites. 82, 83 TT recordings usually involve the piercing of the TM by a needle electrode such that it lodges close to the round window or lies on the cochlear promontory. In contrast, ET recordings are either made from an electrode in contact with the surface of the TM or are attached to the skin of the external auditory meatus in close proximity to the TM. As might be predicted, the further the distance from the cochlea, the more attenuated the response becomes. As also previously discussed, the principal component of the ECochG is a large negativity (N1) which corresponds to the CAP of the acoustic nerve and as such has an identical generator to wave I of the BAEP. 80, 81, 84, 85 The timing of the two waves ( N1 and I ) is therefore synchronous. N1 may be followed by a relatively small negativity labelled N2. N2 usually occurs concurrently with BAEP wave II but on occasions with wave III.
Herein lies the difficulty posed by the ECochG for the MVOBG. The reasoning for this is that if wave II is a BC potential generated in the cochlea, then it follows that ECochG wave N2 must be also. The same applies to any subsequent negative components of the ECochG. So, the question is why N2 is often missing or only present as a shallow deflection instead of the predicted large response. At first sight, it is hard to reconcile the morphology of the standard ECochG waveform with the MVOBG. The characteristic absence of large later negative peaks would therefore seem to put at risk the viability of the revised model. Superficially, it might appear to be more supportive of the OMOBG.
In response, it should be borne in mind that up to four small negative potentials do often follow N1 even if so inconsistently and unreliably and each coincides closely with a BAEP component. 81, 85, 86, 87, 88, 89 So, additional waves do quite commonly appear albeit in a truncated form and therefore the predictions of the MVOBG are at least partially fulfilled. In fact, the most contemporary understanding of the relationship between the BAEP and the ECochG reinforces this concept.90, Figure 7 shows a series of artificial waveforms which summarize the asymmetrical nature of the relationship between the BAEP and ECochG.
Figure 7.Traces A and B display the predicted relationship between the BAEP and the ECochG. In these, each positive BAEP wavelet has a negative counterpart in the ECochG and all the components in each waveform are approximately the same size as the initial one ( I or N1 ). Traces C, D, E and F demonstrate the main four varieties of the ECochG which are actually or routinely recorded. In all four examples, individual components are either missing or else attenuated when compared to hypothetical trace B. Note that these are artificial waveforms not derived from any data and no amplitude or latency scale applies.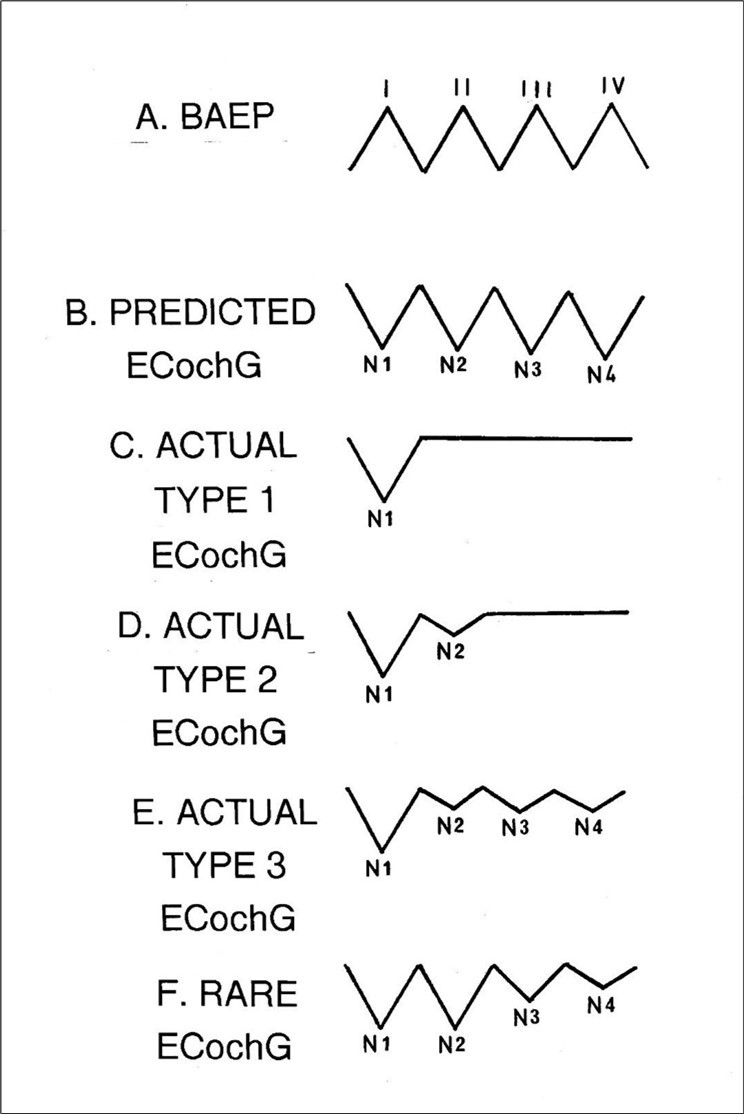
Nevertheless, the question remains why these trains of smaller but often well- defined negative wavelets trailing N1 are not more consistently recorded, let alone amplified. This would, of course, make the ECochG waveform much more compatible with the MVOBG. One possibility is that it is due to the multiple and quite diverse locations from which the ECochG may be recorded . These include not just the ET and TT but also intracochlear sites. However, this seems an unlikely culprit as the non-inverting electrode position determines the gross size of the ECochG rather than altering or modifying its individual components. 82
A second parameter of the electrode array which might be more successful at accentuating later components of the ECochG is the site of the inverting (reference) electrode. Routinely, ECochGs are recorded using a horizontal montage. In practice, this means that the reference electrode is located on either the ipsilateral (lobe or mastoid) or contralateral ear. 80, 82, 91 In fact, reference electrode position does significantly affect the recording. With an ipsilateral array, the signal to noise ratio is enhanced while using a contralateral one enlarges the waveform. 82, 84, 91 Presumably, the differential outcomes can be accounted for mostly by the varying distances between the inverting and non-inverting electrodes.82 Otherwise, there seems little or no evidence from the multiple illustrations in the literature that a horizontal montage has any categorical influence on the shallow deflections following N1.92
The rival vertical montage is not customarily used for clinical recordings of the ECochG. However, it is the standard array for recording the BAEP when the inverting electrode is conventionally placed on the vertex. 93 It is notable that in their pioneering study of the BAEP, Sohmer and Feinmesser 22 did record an ECochG with a vertical montage. Under these conditions, a well-defined N2 and N3 subcomponent was obtained along with a slighter N4. This might suggest that the key to recording a fully developed ECochG waveform may lie with the employment of a vertical montage. Despite this, it is also not difficult to find examples of the ECochG recorded using a horizontal montage where there is a clear-cut series of negative wavelets following N1.94 Conversely, a vertical montage will sometimes generate a poorly defined ECochG , apart from N1. Such an anecdotal analysis might imply that recording an optimal ECochG may need a genuinely neutral reference electrode. Both the vertical and horizontal montages employ cephalic references and many studies of the scalp distribution of BAEPs have demonstrated that no part of the head is electrically inactive with regard to BAEP activity.52, 95
Numerous investigations have disclosed how dramatic changes in the BAEP can occur when employing a genuinely neutral non-cephalic reference.32, 96, 97, 98 Subcomponents can quite rapidly invert in polarity and others can disappear or reappear as the active (cephalic) electrode is shifted. A more rewarding strategy to try to extract or enhance additional negative waves from the ECochG might therefore be to adopt a non-cephalic reference i.e. an inverting electrode which is genuinely indifferent. There are reputedly more than 4000 ECochG publications99 but a random search did not reveal any such recording.
Many other factors might contribute to the discrepancy between the number of (positive) waves generated in the BAEP and the smaller number of (negative) waves habitually generated in the ECochG. These could include skull geometry, head shape and size, dipole orientation and interaction, algebraic summation of potentials and fluid and tissue impedance. However, the typical absence of the predicted components of the ECochG might also be accounted for by the respective electrophysiological status of the two waveforms. The ECochG is designated as a near - field potential because its neural generators lie close to the active electrode. 100, 101 This is distinct from the far - field BAEP which is recorded at a distance from its source via volume conduction or passive electrical spread. Unlike the ECochG, the normal BAEP waveform routinely incorporates a full contingent of four to five major components. This could imply that it is the near-field location of the recording electrode which is the crucial factor in the failure to record the requisite number of components.
If this is the case, then it most likely involves, if not exclusively, the insidious role played by EECs. EECs do interfere or interact with near-field potentials and so distort or obscure their recording. It is therefore possible that they will also do so with the ECochG. This vulnerability would also account for the circumstances where an electrode is almost adjacent to its generator but still fails to detect its activity, as discussed above.
A further consideration is that EECs are dynamic and fluctuate widely. Their activity ramps up dramatically when the neuron is internally active but otherwise remains relatively quiescent. It follows, therefore, that with a train of closely spaced CAPs in the auditory nerve (which the MVOBG depends upon), the first and possibly the second CAP recording could perhaps be spared owing to the acute delay in the onset of the competing EEC activity. However, the later ones would be progressively affected with a reduction in amplitude or more likely be lost altogether. This is, of course, the characteristic pattern of the ECochG. It may also account for the intersubject lability or variability of the waveforms, as illustrated schematically in Figure 7.
In contrast, far-field recordings such as the BAEP may lack temporal and spatial resolution but their signals are recorded at a sufficient distance to escape the detrimental influence of these localized fields. This means that all the principal waves of the BAEP would be recorded intact with a more or less uniform size as illustrated in Figure 1. While such a mode of action as outlined above is certainly conceivable, whether it can provide a satisfactory or realistic explanation for the anticipated but often missing components of the ECochG remains debatable.
In summary, there is at present no satisfactory explanation as to why the ECochG does not routinely consist of a series of uniformly robust negative wavelets in a similar manner as the BAEP is composed of four to five prominent positive components. While this discrepancy is sometimes acknowledged,90 the reasons for it are seldom, if ever, discussed. The tenets of the MVOBG would, at least in principle, predict their existence. To what extent this absence represents an existential threat to the MVOBG or is simply an artifact of electrode array or derivation remains unknown.
By a process of elimination, it has been presently shown that the most promising electrode montage to record an optimum ECochG may involve the employment of a non-cephalic reference. In the apparent unavailability of such recordings, it would seem a priority to arrange a formal test where TT or ET electrodes are referred to a variety of electrically neutral sites. This might help resolve the most perplexing and troublesome feature of the MVOBG.
The Puzzle of the Single Wave BAEP
Clinico-pathological investigations such as those reported by Starr and co- workers 27, 28 also represent a challenge to the MVOBG. In this case a total of 16 patients with a variety of neurological disturbances or diseases including anoxia, tumor, infarction and demyelinating disease were studied. Each patient was accompanied by an illustration of at least one BAEP making a total of 26 recordings, sometimes monaural and sometimes binaural. All the BAEPs could be quite easily slotted into one of three basic categories with only the occasional difficulty. Type 1 was the complete absence of any wavelets (n=4). Type 2 was the preservation of wave I but the total absence of any later activity (n=10). Type 3 was the presence of wave I and at least one of the later waves (n=12). None of these patterns had any diagnostic significance.
Neither type 1 nor type 3 BAEPs are necessarily nor unconditionally incompatible with the predictions of the MVOBG. However, if it is assumed that all the waves arise in the acoustic nerve, then a type 2 BAEP should never or only very rarely be observed. The reasoning underlying this expectation is that if the peripheral auditory system is sufficiently viable or intact to generate wave I, then it should be able to produce at least an additional wave, even if the auditory stimulus arrives at the cochlea via different routes.
According to the MVOBG, the basic rule governing BAEP abnormalities can be summarized as follows: The BAEP must contain some waves or no waves but not just a single isolated wave I. Either all the components are missing (type1) or else wave I and at least one other component are preserved (type 3). This principle obviously does not allow for a type 2 abnormality despite the fact that 40% of Starr’s recordings were fairly clearly of this nature. The survival of wave I in the absence of any later activity is difficult to reconcile with the MVOBG and therefore represents a significant challenge to it. The allowable and prohibited BAEP waveforms are shown schematically in Figure 8.
Figure 8.Schematic illustration of the four waveforms which are compatible with the new version of BAEP generation and the one which is not.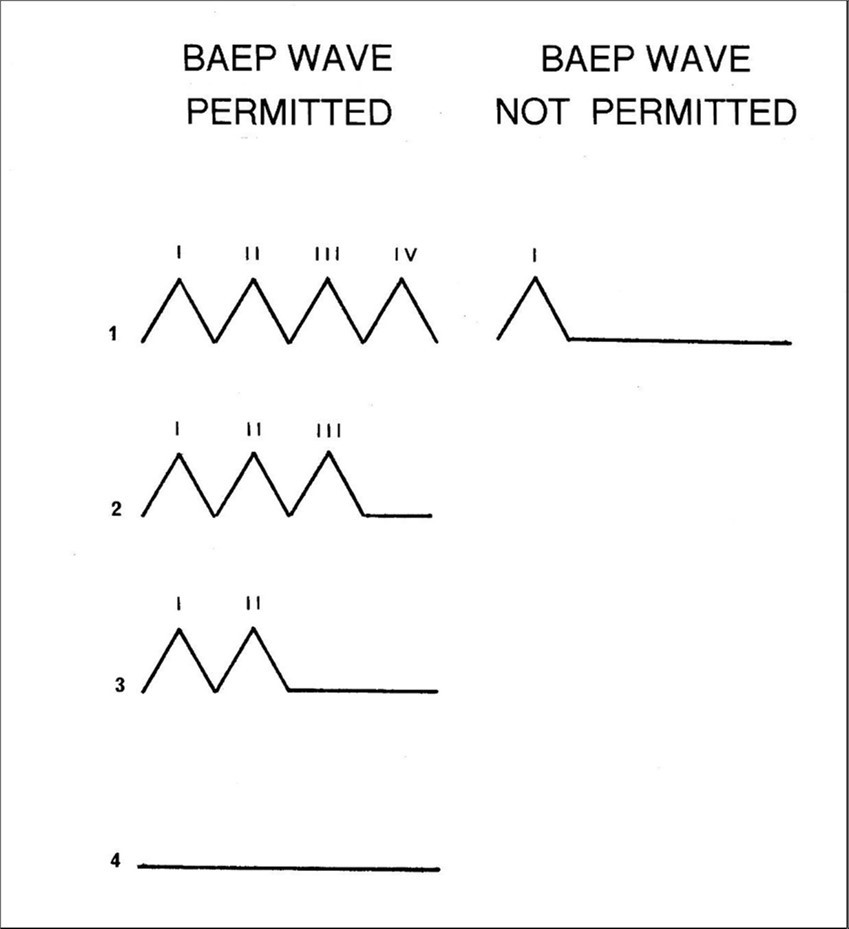
There is, however, a possible solution to this seeming paradox. It relies upon the quite common phenomenon in clinical neurophysiology where two neuroelectric potentials of similar morphology are generated in close temporal contiguity. Normally, one is dominant and so routinely eclipses or masks the secondary or subordinate one. However, if the primary or superior potential temporarily disappears or is permanently abolished, there is an opportunity for the usually occluded or minor response to become exposed. This supplanted response is now likely to be mistaken for the original potential thereby creating the illusion that at least some version of the latter is still extant or preserved.
A series of experiments conducted in a French laboratory reported an example of this phenomenon. 102, 103, 104, 105, 106, 107, 108 Most relevantly, these also involved the auditory system. In this case, subjects were guinea pigs whose cochlear function was destroyed with the antibiotic amikacin. However, this ototoxic agent spared activity in the nearby vestibular hair cells. ECochGs were recorded from both the treated and normal animals.
Following decimation of the cochlear machinery, a waveform could still be consistently recorded with a morphology which resembled the standard ECochG but with a slightly shorter N1 latency and a diminished size. As the organ of Corti was no longer operational, this waveform must have arisen in the vestibular apparatus, most likely, the saccule. Subsequent electrophysiological recordings in the saccular branch of the vestibular nerve,108 extracellular single – unit recordings from vestibular neurons,109 and differential ablation of cochlear and vestibular sites107 confirmed this suspicion.
In addition, BAEPs were recorded following amikacin intoxication.105 Following loss of cochlear activity, only the first of the high frequency components was still present albeit with a slightly earlier peak latency than the orthodox BAEP Wave I. As this wave was assumed to be the saccular analog of the cochlear BAEP, it is currently referred to as the saccular AEP ( SAEP ). Further, its sole wave would therefore similarly reflect the CAP arising in the vestibular division of the vestibulocochlear nerve.103 That the saccule could generate an auditory potential in the vestibular nerve is hardly surprising. This is because in lower vertebrates, such as amphibians and fishes, the saccule is the primal organ of hearing.110
Exactly how AC sounds could stimulate the hair cells of the saccule and therefore evoke a SAEP is uncertain. 99, 111, 112 Conceivably, it involves sound- induced pressure waves in both the perilymph and endolymph fluids displacing and thereby depolarizing the saccular hair cell receptors. In particular, endolymph flows throughout the membranous labyrinth and fluid pressure waves transfer directly from the cochlear duct to the saccule via the ductus reuniens channel.
Such findings with the guinea pig might be transferable to humans. If this is the case, it may require a reinterpretation of the status of a type 2 BAEP abnormality where wave I has ostensibly been preserved. Instead of being considered a genuine, albeit seriously abnormal BAEP bereft of all but its earliest component, it might be better understood as a more or less intact human version of the SAEP masquerading as BAEP wave I. It would be assumed that the human SAEP has become visible after being unmasked following the complete abolition of the actual BAEP waveform. This interpretation implies that a type 2 BAEP is really no more than a variation of a type 1. In other words, a type 2 BAEP may, in fact, be a sign that the waveform has been totally extinguished and not that some early component still exists.
As argued above, a type 1 BAEP is consistent with the MVOBG although it does not provide any direct evidence for it. It was further demonstrated that type 1 was possibly equivalent to a type 2 BAEP even if the latter had elements of a vestibular AEP embedded into it. It follows therefore that a type 2 BAEP, contrary to superficial appearances, could still be compatible with the basic tenets of the MVOBG. At this stage, much of the preceding discussion is speculative so it remains a matter of opinion as to how successfully it deals with one of the more vulnerable features of the MVOBG.
Nevertheless, some support for this idea might be gained from a patient presented by Starr 113 who suffered an anoxic episode and was eventually declared brain dead. In the earlier recordings, all five BAEP waves were clearly identifiable. In the final recordings, all but the first wave had disappeared and the EEG was isoelectric. However, the surviving component had subtle but distinct differences in latency, amplitude and morphology from the previous recordings of wave I. Although not unequivocal, this observation is consistent with the interpretation that it may not have been a genuine BAEP wave I but instead had been replaced by the SAEP.
It is presently argued that wave I of the BAEP and the SAEP are homologous potentials reflecting the CAP in first-order sensory neurons following electromechanical transduction at the hair cells. This begs a final question as to why the SAEP manages to survive for a longer period of time than the BAEP thereby creating the illusion of the continuing existence of wave I. At least part of the explanation may be that saccular function is a good deal more resistant to anoxic-hypoxic encephalopathy than the more susceptible cochlea. This is because the cochlea is significantly more metabolically active than the saccule (and utricle) and therefore demands a greater blood supply to satisfy its energy requirements. This means, in effect, that in a state of O2 deprivation, the SAEP arising in the vestibular system will likely be able to persevere for an extended time compared to the more vulnerable cochlear potential (the BAEP).
The idea that the SAEP may represent a type of double for the BAEP and so be potentially mistaken for it does provide a logical and intriguing explanation for the existence of a lone wave I. However, it is still quite tentative and there are no doubt alternative interpretations. In addition, it is almost entirely derived from guinea pig data and so findings must be extrapolated with caution. At present, there seems no direct evidence that a SAEP arises in the vestibular apparatus in humans. This matter could be further investigated by recording otolith function in conjunction with a type 2 BAEP. A version of the vestibular evoked myogenic potential ( VEMP ) can specifically record saccular activity. The caveat is that the subject must be not only conscious but also co-operative.
The Velocity of Sound Waves in Cranial Bones
The next challenge is superficially among the most serious to the MVOBG. Fortunately, unlike the previous problem with the ECochG, it can be fairly readily resolved. This concerns the speed with which sound vibrations are propagated in different mediums. Sound transmission in air is 330 m/sec.114 By contrast, sound wave transmission in a dense medium such as bone is, on average, about ten times faster than in air. This ranges from 2800 m/sec for transverse, to 4080 m/sec for longitudinal waves.114 According to such values, it would be calculated that BC sound waves should arrive at the cochlea significantly earlier than AC waves. It would therefore be predicted that a BC wave I of the BAEP would be generated somewhat sooner than an AC wave I in the conventional BAEP.
If wave II is, in fact, actually wave I of the BC BAEP as the MVOBG claims, then such a wave should precede wave I of the AC BAEP but it doesn’t. There has never been any evidence of the existence of such an early potential. It follows therefore that the origin of the second component of the BAEP (wave II) is very unlikely to be the initial component of the BC BAEP. Clearly, if the preceding analysis is correct, then it represents a paradoxical situation quite damaging to the MVOBG.
The resolution of this difficulty is comparatively simple. The explanation is that sound transmission within the cranial bones is quite atypically slow. Since the original experiments of von Bekesy in the late 1940s, several investigators have measured the CV of sound waves within the cranial bones. 115, 116, 117, 118, 119, 120, 121 Estimates ranged from 250 – 570 m/sec depending upon the physical properties of the waves and the location in the skull from which the measurements were made. Taking into account the various values that were reported in these, a gross mean sound wave speed in the skull bones of 350 m/sec was found. This is, of course, almost identical to the speed of sound in air and is the reason why Stenfelt and Goode 119 concluded that “ the propagation velocity of BC sound seems to be similar to the velocity of air borne sound”. It would therefore be expected that wave I of the BC BAEP should occur in close temporal proximity to wave I of the AC BAEP and certainly not substantially earlier. Therefore, any attempt to discredit the MVOBG using generic information on the speed of sound in bony structures must be considered inappropriate and fallacious and should be dismissed. Further, the idea that wave II of the conventional BAEP could be a BC component is therefore not necessarily unsound or illogical and is, at the least, consistent with its timing.
The question still remains why CV within the cranium is so comparatively slow. It is no doubt due to a potpourri of agents and factors although one part of the explanation is quite apparent. This is because the term BC is somewhat nonspecific. It is often used as a composite measure encompassing not only the genuine speed of the acoustic wave within the bone but also that in other mediums which the vibratory signal may traverse.121, 122 These could include skin, hair, cartilage, cerebral fluids (CSF), and soft tissue ( brain and muscle ).121 All of these have speed of sound transmission significantly less than that of the standard bone.114 Stenfelt 121 described this component as the body conduction as distinct from the BC. This lack of differentiation would therefore reduce the overall BC value.
Other factors might include the composition of the skull from plates bound together by sutures thereby creating barriers which could hinder efficient flow of acoustic signals.121 In addition, the heterogeneous and layered nature of skull bones, characterized by being more rigid and dense in the interior, plus the often spongy or cancellous fabric in the core, will all contribute to different CVs. 120, 122, 123, 124 Finally, the mastoid process is pitted with air cells which might be expected to slow progress of the sound wave toward the cochlea. Assuming the integrity of the MVOBG, it is presumed one or, more likely, several of these features are responsible for ( BC ) wave II being generated within 1 msec of (AC ) wave I.
Further insights into the relationship between AC BAEPs and BC BAEPs can be gained by directly comparing the latencies of their individual subcomponents.125, 126, 127, 128, 129, 130, 131, 132 In these investigations, a bone vibrator was placed on the forehead or mastoid and sensation level equated with the AC sound wave.133 Because artifact from the vibrator makes early waves of the BAEP waveform difficult to identify, wave V was employed as a proxy for wave I in the following analysis. The relevant findings from the eight studies are summarized in Figure 9 and these furnish two important observations. First, the AC BAEP always precedes the BC waveform. Second, this is by a very fine margin as the delay between the BC and the AC waves is never more than 1 msec. This small but consistent lag tends to suggest that there may be a common factor operating. There are a number of possibilities which could account for the increase in latency of the BC signal.
One possibility is that the longer latency is simply due to differences in the frequency spectra generated by the transducers. 125, 126, 128, 134 Bone vibrators have a lower frequency output than earphones and so will activate more distant zones of the cochlear spiral and therefore will have to travel further before neural encoding of such signals occurs.
A second possibility is that the slightly longer latencies of the BC BAEP are due to the different modes of transport in air and bone. 130, 131 Presumably, this would be due to the nature of the wave which conducts the signals. Sound waves in air are delivered solely by longitudinal waves. In contrast, bone vibrations are propagated by a combination of longitudinal ( faster ) and transverse ( slower ) waves which might be intrinsically less efficient.
A third possibility is a variation of the first. 4, 126, 128, 129, 132, 134 In this case, it is not the properties of the stimulating apparatus which are responsible for the latency gap. Rather, it is those of the petrous bone where its absorptive and dampening properties may staunch the flow of higher frequency energy. Essentially, therefore, the cochlear wall is conceived as acting as a type of low pass filter allowing the passage of lower frequency vibrations but blocking higher frequency signals before conversion into travelling waves. These, as discussed before, are preferentially processed in the apical regions of the basilar membrane. In comparison, the high frequency AC signals will activate the earlier basal sites. Hence, the small relative increase in latency of the BC wave would be due to the longer conduction time before its activation.
Exactly how long a travelling wave takes to traverse the basilar membrane is difficult to measure with any precision. This is because its velocity tends to vary between 20 – 100 m/sec as it negotiates the cochlear spiral. Nonetheless, assuming an average velocity of 50 m/sec plus a length of the basilar membrane of 35 mm in an adult, this would yield a CT of 0.7 msec from base to apex. A previous independent calculation produced a CT of 0.5 msec. 134 Such estimates are quite compatible with the data presented in Figure 9 and therefore a credible explanation for the delay between the BC and the AC waves.
Figure 9.The time difference between an air-conducted BAEP wave and its homologous bone-conducted wave. In this case, the component analyzed is wave V for reasons described in the text. The data in the figure is derived from eight separate studies using human adults as subjects.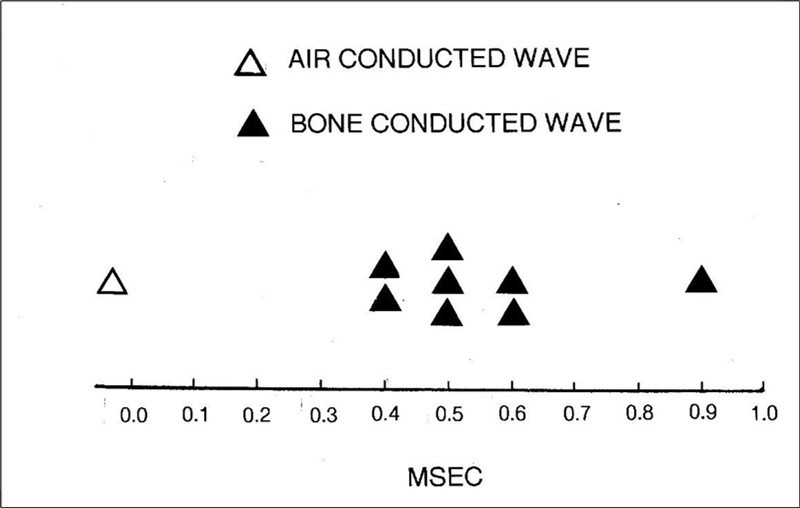
In summary, the present examination of the timing of AC and BC BAEPs is broadly supportive of the MVOBG. According to this, wave II of the conventional BAEP is, in reality, wave I of the BC BAEP. If this is the case, then both of these waves should behave in a similar manner. Judging by the information analyzed, it would therefore be expected that wave II should arrive no later than 1 msec after wave I (Figure 1). The interpeak latency of waves I and II in humans is approximately 1 msec, so the prediction is basically confirmed. This analysis of the relative timing of the various BAEP waves does not, of course, provide any direct proof of the MVOBG. Nonetheless, it does lend some quite powerful circumstantial evidence in support.
The Timing of Reflections Within the Petrous Bone
The petrous bone is the default location from which a sound wave rebound might originate and so restimulate the cochlea. Nonetheless, this site of action does possess one potential difficulty. As alluded to previously, the petrous bone is a comparatively small triangular structure with dimensions of approximately 4 x 2 x 2 cm. This implies that CTs of acoustic signals within the bone itself must be quite limited. A rough estimate of CTs could be calculated by assuming the speed of sound within a cranial bone referred to previously ( 350 m/sec ). Considering the dimensions of the petrous bone, the total distance a reflected sound wave would travel internally is unlikely to exceed 10cm. This would mean that the transit time for a reflected signal to return to reactivate the cochlea should be less than 0.3 msec. This is somewhat short of the approximately 1 msec which might have been anticipated.
Part of this discrepancy might well be accounted for by a time delay imposed by the nature or characteristics of the reflexive surface. This could produce phase distortions, diffusion, dispersion or absorption and would be consistent with the diverse anatomical features of the petrous bone summarized in Figure 6. If these effects are insufficient or inadequate, it may be necessary to search for a suitable source for the reflected signals outside the petrous bone in order to make the MVOBG work.
Conclusions
According to Occam’s razor, entities should not be multiplied beyond necessity. The MVOBG does not seriously question the longstanding and bedrock premise that the BAEP represents a genuine neuronal signal being transmitted from the depths of the brain. Nonetheless, the principle of parsimony is a reminder that the simpler an explanation for a particular phenomenon is, the more likely it is to be correct. Therefore, the MVOBG must be considered, by some magnitude, a superior explanation to the OMOBG. This is clearly demonstrated because it locates all four (or five) major BAEP components quite specifically and parochially within the vestibulocochlear nerve and so reduces all the wavelets to essentially just variants of the CAP. This is in contrast to the OMOBG where the electrogenesis of the waves (II, III, IV, and V) is far more convoluted and less tangible. In particular, the MVOBG provides a solution to what is arguably the most enduring and perplexing mystery of the BAEP. This is the question of exactly where the supposed brainstem components are hiding. Wave I can be readily located in the auditory nerve. However, no one has ever satisfactorily discovered the whereabouts of the homologous sharp waves in the auditory brainstem’s maze of nuclei, fibers and decussations. Attempting to find them has proven to be an elusive exercise. Instead of having a physical location, they seem disembodied, existing in time but not space and only optimally recorded at a distance from their assumed generators. This is a very unsatisfactory conception with few precedents in clinical neurophysiology. Attempts to rescue the OMOBG by claiming each wave is a composite of activity from multiple generators also fall foul of Occam’s razor. It is reminiscent of Ptolemaic astronomy’s employment of epicycles and the like to try to salvage the geocentric model of the solar system.
A certain number of insights concerning the electrogenesis of the BAEP can be gained solely by examining standard waveforms such as those illustrated in Figure 1. Most obvious is that the waveform consists exclusively of a series of high frequency sharp components. These are the distinctive and unique signature of the CAP. This means that no matter whatever location or level within the auditory system each wave actually arises from, it must be from an axonal tract. If indeed the BAEP is mostly a measure of brainstem activity, then one question is inescapable. Where in the mesh and tangle of connections within the mammalian auditory brainstem lie the two or three discrete pathways from which the waves would be expected to arise?
By contrast, a post-synaptic potential has a slower configuration with a much lower frequency content and therefore cannot be confused with a CAP. 101, 135, 136, 137, 138 This further means that BAEP waves do not possess a nuclear origin and therefore cannot be generated in or near synaptic relays such as the cochlear nucleus, superior olivary complex, inferior colliculus and medial geniculate body. All of these a priori deductions concerning the nature of the BAEP can be quite readily accommodated by the MVOBG whereas the OMOBG would struggle to cope.
A second revelation can be observed in many, although not all, waveforms. These are the occasions where the major four or five components are followed by a trail of smaller wavelets. An example is the bottom trace in Figure 1 although a very vestigial type can also be discerned in the two upper traces. What is especially noteworthy about such a sequence is that the frequency of the later potentials is almost exactly the same as the early principal ones. This inevitably raises the suspicion that some type of reverberatory phenomenon is operating. This must also call into question the ontological status of the initial dominant waves, with the exception of wave I. Again, the MVOBG would have no difficulty incorporating and thereby dealing with such a repetitive pattern, as previously discussed in the section on the generation of the BAEP waves. However, this category of waveform poses obvious conceptual and interpretive hurdles for the orthodox model of BAEP generation.
While the MVOBG can provide a nearly complete explanation for the origins of the BAEP within a relatively uncomplicated framework, there nevertheless remain some gaps, inconsistencies and obstacles which will need to be addressed. The least serious of these concerns the question of why the BC waveform consistently seems to follow the AC BAEP even though the time gap is slight. There are, nonetheless, several feasible explanations for this occurrence.
The second difficulty is the question of why the ECochG does not normally or usually consist of four or five major subcomponents in the same manner as the BAEP. This is a more generic problem in clinical neurophysiology which is usually only implicitly acknowledged. At this stage, there is no definitive solution but it could, needless to say, present a risk to the MVOBG.
The third question pertains to the identity of the lone wave I when all the following components have disappeared. According to the OMOBG, this wave is still the actual initial response of the conventional BAEP. In opposition, the MVOBG could maintain that this is an impostor wave most likely originating in the vestibular apparatus rather than the cochlea. Sorting out the status of wave I with such a configuration would therefore be a critical task for clinical interpretations of the BAEP. This would be especially so if employed in the diagnosis of brain death when evidence that the sensory receptor is still functioning is vital. 113, 139
A final discrepancy is that it is difficult to reconcile the hypothetical rebound time of an acoustic signal within the petrous bone with the longer expected value. It is uncertain whether this implies that the petrous bone must be abandoned as the site of the reflective activity which is such a critical constituent of the MVOB.
The MVOBG has been constructed mostly, and probably inevitably, from animal data. However, if this explanation is considered to have merit and therefore worth pursuing, a viable human preparation with which to test it further is probably necessary. The obvious candidate to mimic the paralysis of ossicular function caused by high frequency click stimulation would be severe otosclerosis. According to McGee and Clemis 140 the recording of BAEPs in the assessment of conductive hearing loss is of limited clinical value. As a consequence, there are very few reports of the effects of otosclerosis on the waveform. In their study, McGee and Clemis did record BAEPs from 23 patients ( 32 ears ) with conductive hearing loss including six with otosclerosis.
Remarkably, in more than half the affected ears, no wave I could be detected. Hall 4 later described this data as “important”, but the authors otherwise offered no explanation for such puzzling and surprising findings. They are, of course, readily explicable according to the tenets of the MVOBG.
Irrespective of its electrogenesis, one of the more confusing aspects of the BAEP is the precise relationship between the five dominant waves of the human BAEP and just the four principal waves of the smaller mammals which are the frequent subjects for animal experimentation. According to the OMOBG, waves I and II of the human BAEP are usually considered to be equivalent to wave I of the small mammalian waveform. It therefore follows that wave III of the human BAEP corresponds to wave II of the animal BAEP, wave IV ( human ) to wave III ( animal ) and finally wave V ( human ) to wave IV ( animal ). If this is the case, it does beg the question why the ECochG does not routinely consist of both a large N1 and N2 component since both waves are assumed to arise in the 8th nerve.
In the case of the MVOBG and the four component animal BAEP, wave II must represent the first BC potential. However, with the five component human BAEP, the paradigm becomes more complex which makes it difficult to identify which is the initial BC wave. This matter should be clarified with a human preparation such as that proposed above using otosclerosis. Judging by the preliminary data, it would appear that both animal and human BAEPs adhere to the same basic pattern. That is; in both instances, wave II is the first of the BC potentials. In this conception, wave V of the human BAEP is simply generated by a later ( third ) BC echo.
The present reinterpretation of the electrogenesis of the BAEP argues that brainstem activity contributes little, if anything, to the waveform. Calling the response the BAEP, or some similar moniker, may therefore be a misnomer. A more appropriate title might be the auditory nerve evoked potential (or ANEP). It is also noteworthy that in the first formal account of the proto – BAEP, the authors did consider that all the major waves might have arisen in the 8th nerve.22 However, their explanation of how this could occur was quite different to that currently proposed and they otherwise showed no interest in pursuing this notion.
The BAEP and ECochG are close electrophysiological relatives. In a recent editorial reviewing the current standing and utility of the ECochG 83 the authors concluded:
“Once a knowledge base becomes firmly entrenched, it can sometimes be difficult and uncomfortable to realize that a framework is no longer adequate to encapsulate new findings, and needs updating”.
Judging by the present analysis, this cautionary advice might be even more apposite when applied to the BAEP.
Acknowledgements
The author thanks Professor Maurice Curtis of the Department of Anatomy and Medical Imaging, Auckland University, for the opportunity to write this review.
The author thanks the late Dr Barry Cant for his insightful critique of the ideas in this review.
References
- 1.M E Glasscock, C G Jackson, A F Josey. (1981) Brain Stem Electric Response Audiometry.Thieme-Stratton. , New York
- 5.F H Bess, L E Humes. (2008) . Audiology: The Fundamentals, 4th Edition.Lippincott , Williams and Wilkins, Philadelphia .
- 11.G. (2011) Brainstem auditory evoked potentials (BAEPs) and other auditory evoked potentials. Niedermeyer’s Electroencephalography, 6th Edition.Lippincott da Silva, F.H. (Eds.) , Williams, In: Schomer, D. L., & Lopes 975-1002.
- 12.Yamada T, Meng E. (2011) Practical Guide for Clinical Neurophysiologic Testing.Wolters Kluwer Health. , Philadelphia
- 13.S R Atcherson, T M Stoody. (2012) Auditory Electrophysiology: A Clinical Guide.Thieme. , New York
- 14.A M Husain. (2014) Evoked potentials overview. In:. Current Practice of Clinical Electroencephalography, 4th Edition.Wolters Kluwer Health , Philadelphia 442-487.
- 15.Katz J, Chasin M, English K, L J Hood, K L Tillery. (2015) . Handbook of Clinical Audiology, 7th Edition.Wolters Kluwer , Philadelphia .
- 19.D L Jewett. (1970) Volume-conducted potentials in response to auditory stimuli as detected by averaging in the cat.ElectroencephalogrClinNeurophysiol28. 609-618.
- 20.D L Jewett, M N Romano, J S Williston. (1970) Human Auditory evoked potentials: possible brain stem components detected on the scalp.Science167. 1517-1518.
- 21.D L Jewett, J S Williston. (1971) Auditory-evoked far fields averaged from the scalp of humans.Brain94. 681-696.
- 22.Sohmer H, Feinmesser M. (1967) Cochlear action potentials recorded from the external ear in man.Ann OtolRhinolLaryngol76. 427-435.
- 23.D L Jewett. (1983) Introduction. In: Moore. , New York, xxi-xxx, E. J. (Ed.) Bases of Auditory Brain-Stem Evoked Responses.Grune
- 24.A R Moller. (1985) Physiology of the ascending auditory pathway with special reference to the auditory brainstem response. 23-41.
- 25.A R Moller, Burgess J. (1986) Neural generators of the brain-stem auditory evoked potentials (BAEPs) in the rhesus. 65-361.
- 26.J, J E Stockard, F W Sharbrough. (1977) Detection and localization of occult lesions with brainstem auditory responses.Mayo Clin. Proc52 761-769.
- 27.Starr A, L J Achor. (1975) Auditory brain stem responses in neurological disease.ArchNeurol32. 761-768.
- 28.Starr A, A E Hamilton. (1976) Correlation between confirmed sites of neurological lesions and abnormalities of far-field auditory brainstem responses.ElectroencephalogrClinNeurophysiol41. 595-608.
- 29.L J Achor, Starr A. (1980) Auditory brain stem responses in the cat. I. Intracranial and extracranial recordings.ElectroencephalogrClinNeurophysiol48. 154-173.
- 30.L J Achor, Starr A. (1980) Auditory brain stem responses in the cat. II. Effects of lesions. , Electroencephalogr Clin Neurophysiol 48, 174-190.
- 31.A R Moller. (2006) . Hearing: Anatomy, Physiology, and Disorders of the Auditory System, 2nd Edition.Academic Press , Burlington .
- 32.T W Picton, S A Hillyard, H I Krausz, Galambos R. (1974) Human auditory evoked potentials. I: Evaluation of components.ElectroencephalogrClinNeurophysiol36. 179-190.
- 33.K T, J V Beardsley. (1979) Brain stem auditory evoked response.Ann. OtolRhinolLaryngol88 58, 1-28.
- 38.D L Schomer, H Lopes da Silva F. (2011) . Niedermeyer’s Electroencephalography, 6th Edition.Lippincott , Williams and Wilkins, Philadelphia .
- 39.M J Aminoff. (2012) . Aminoff’s Electrodiagnosis in Clinical Neurology, 6th Edition.Elsevier Saunders , Philadelphia .
- 40.J S Ebersole, A M Husain, D R Nordli. (2014) . Current Practice of Clinical Electroencephalography, 4th Edition.Wolters Kluwer Health , Philadelphia .
- 42.J R Madell, Flexer C. (2014) . Pediatric Audiology: Diagnosis, Technology, and Management, 2nd Edition.Thieme , New York .
- 46.N A Shaw. (1995) The temporal relationship between the brainstem and primary cortical auditory evoked potentials.ProgNeurobiol47. 95-103.
- 47.G J Tortora, Derrickson B. (2009) . Principles of Anatomy and Physiology, 12th Edition.John , New York .
- 49.Y S Lee, Lueders H, D S, R P Lesser, Hahn J. (1984) Recording of auditory evoked potentials in man using chronic subdural electrodes.Brain107. 115-131.
- 50.Liegeois-Chauvel C, Musolino A, Chauvel P. (1991) Localization of the primary auditory area in man.Brain114. 139-153.
- 51.Arezzo J, Pickoff A, H G Vaughan. (1975) The sources and intracerebral distribution of auditory evoked potentials in the alert rhesus monkey.Brain Res90. 57-73.
- 52.A R, Starr A. (1978) Auditory brain stem potentials. in monkey (M. mulatta) and man.ElectroencephalogrClinNeurophysiol45 53-63.
- 53.L N Sutton, Frewen T, Marsh R, Jaggi J, D A Bruce. (1982) The effects of deep barbiturate coma on multimodality evoked potentials.JNeurosurg57. 178-185.
- 54.B M Chen, J S Buchwald. (1986) Midlatency auditory evoked responses: differential effects of sleep in the cat.ElectroencephalogrClinNeurophysiol65. 373-382.
- 57.Cazals Y, Aran J-M Erre, J-P. (1983) Intensity difference thresholds assessed with eighth nerve and auditory cortex potentials: compared values from cochlear and saccular responses.Hear Res10. 263-268.
- 58.H C Stronks, M C Aarts, S F Klis. (2010) Effects of isoflurane on auditory evoked potentials in the cochlea and brainstem of guinea pigs. Hear Res 260. https://doi.org/10.1016/j.heares.2009.10.015
- 59.E F Ragi. (1986) Evidence for a peripheral origin of the brainstem auditory evoked potential.ElectromyogrClinNeurophysiol26. 13-26.
- 61.N A Shaw. (1990) The effects of stimulus rate on the brainstem auditory evoked potential.ElectromyogrClinNeurophysiol30. 195-203.
- 62.Dauman R. (2013) Bone conduction: an explanation for this phenomenon comprising complex mechanisms.EurAnnOtorhinolaryngolHead Neck Dis130. 209-213.
- 64.Don M, A R, Starr A. (1977) Effect of click rate on the latency of auditory brain stem responses in humans.Ann OtolRhinolLaryngol86. 186-195.
- 66.Robinson K, Rudge P. (1982) Centrally generated auditory potentials. In:. Evoked Potentials in Clinical Testing.Churchill , Livingstone, Edinburgh 345-372.
- 67.Tsuchitani C. (1983) Physiology of the auditory system. In: Moore. , New York, E. J. (Ed.), Bases of Auditory Brain-Stem Evoked Responses.Grune 67-108.
- 68.M W Church, D W Shucard. (1987) Pentobarbital- induced changes in the mouse brainstem auditory evoked potential as a function of click repetition rate and time postdrug.Brain Res403. 72-81.
- 70.Thornton A R D, M J Coleman. (1975) The adaptation of cochlear and brainstem auditory evoked potentials in humans.ElectroencephalogrClinNeurophysiol 39. 399-406.
- 71.M L Hyde, Stephens S D G, Thornton A R D. (1976) Stimulus repetition rate and the early brainstem responses.Br JAudiol10. 41-46.
- 72.Pratt H, Sohmer H. (1976) Intensity and rate functions of cochlear and brainstem evoked responses to click stimuli in man.ArchOtorhinolaryngol21. 85-92.
- 73.Huang C-M, J S Buchwald. (1978) Factors that affect the amplitudes and latencies of the vertex short latency acoustic responses in the cat.ElectroencephalogrClinNeurophysiol44. 179-186.
- 74.M W Church, H L Williams, J A Holloway. (1984) Brain-stem auditory evoked potentials in the rat: effects of gender, stimulus characteristics and ethanol sedation. , Electroencephalogr Clin Neurophysiol 59, 328-339.
- 78.K R Henry. (1979) Differential changes of auditory nerve and brain stem short latency evoked potentials in the laboratory mouse.ElectroencephalogrClinNeurophysiol46. 452-459.
- 79.N A Shaw. (1986) The effect of pentobarbital on the auditory evoked response in the brainstem of the rat.Neuropharmacology25. 63-69.
- 80.Gibson W P R. (1982) . Evoked Potentials in Clinical Testing.Churchill , Livingstone, Edinburgh 311.
- 82.Kumaragamage C, Lithgow B, Moussavi Z. (2015) A new low-noise signal acquisition protocol and electrode placement for electrocochleography (ECOG) recordings.MedBiolEngComput53. , 499 – 509, 10-1007.
- 83.Pienkowski M, O F Adunka, J T Lichtenhan. (2018) New advances in electrocochleography for clinical and basic investigation.FrontNeurosci12. 310-10.
- 84.Sohmer H, Feinmesser M. (1974) . Electrocochleography in clinical – audiological diagnosis.ArchOtorhinolaryngol206, 91 – 102-10.
- 85.J A Ferraro. (2000) Clinical electrocochleography: overview of theories, techniques and applications.Audiology Online.
- 86.P S Roland, Rosenbloom J, Yellin W, W L Meyerhoff. (1993) . Intrasubject test – retest variability in clinical electrocochleography.Laryngoscope103, 963 – 966 10-1288.
- 87.S, M de Oliveira Beck R, Loureiro R S C. (2017) Normative data for TM electrocochleography measures. , Rossi A C, de Almeida E R et 12, 10-1016.
- 89.S, J T Lichtenhan. (2023) . Minimum detectable differences in electrocochleography measurements: Bayesian – based predictions.J Assoc ResOtolaryngol24, 217 – , Jennings S G ( 237-10.
- 90.K C Harris, Bao J. (2022) Optimizing non-invasive functional markers for cochlear deafferentation based on electrocochleography and auditory brainstem response.JAcoustSoc. Am151, 2802 – 2808-10.
- 91.M J Simpson, S G Jennings, R H Margolis. (2020) Techniques for obtaining high-quality recordings in electrocochleography.FrontSystNeurosci14. 18-10.
- 92.Noguchi Y, Nishida H, Komatsuzaki A. (1999) A comparison of extratympanic versus transtympanic recordings in electrocochleography.Audiology38. 135-140.
- 93.Robinson K, Rudge P. (1982) Centrally generated auditory potentials. In:. Halliday, A.M. ( Ed. ), Evoked Potentials in Clinical Testing.Churchill , Livingstone, Edinburgh 345-372.
- 94.Mori N, Saeki K, Matsunaga T, Asaib H. (1982) . Comparison between AP and SP parameters in trans- and extratympanic electrocochleography.Audiology21, 228 – 241-10.
- 95.R G Plantz, J S Williston, D L Jewett. (1974) Spatio-temporal distribution of auditory-evoked far field potentials in rat and cat.Brain. , Res68, 55 – 71, 10-1016.
- 96.Terkildsen K, Osterhammer P, F Huis in’t Veld. (1974) Far field electrocochleography, electrode positions. Scand Audiol 3,123 – 129-10.
- 97.L J Streletz, Katz L, Hohenberger M, R Q Cracco. (1977) Scalp recorded auditory evoked potentials and sonomotor responses: an evaluation of components and recording techniques.ElectroencephalogrClinNeurophysiol43. , 192 – 206, 10-1016.
- 98.Starr A, Squires K. (1982) Distribution of auditory brainstem potentials over the scalp and nasopharynx in humans.Ann NYAcadSci388,427. 442, 10-1111.
- 99.D J Brown, C J Pastras, I S Curthoys. (2017) Electrophysiological measurements of peripheral vestibular function – A review of electrovestibulography.Front SysNeurosci11. 34-10.
- 100.S B Rutkove. (2007) Introduction to volume conduction. In : Blum, A.S., & Rutkove, S.B. ( Eds.),The Clinical Neurophysiology Primer , Totowa 53, 10-1007.
- 101.O N Markand. (2020) Basic techniques of evoked potential recording. In: Clinical Evoked Potentials: An Illustrated Manual.Springer. , Cham 1, 10-1007.
- 102.Cazals Y, Erre J- P, Guilhaume A. (1979) Conflicting electrophysiological and anatomical data from drug-impaired guinea pig cochleas.ActaOtolaryngol87, 300 –. 309-10.
- 103.Cazals Y, Aran J- M, Erre J- P, Guilhaume A, J E Hawkins. (1979) Neural” responses to acoustic stimulation after destruction of cochlear hair. , cells.ArchOtorhinolaryngol224 ,61 – 70, 10-1007.
- 104.Aran J-M, Cazals Y, Sauvage R C de, Guilhaume A, Erre J-P. (1980) Electrophysiological monitoring of the cochlea during and after total destruction of the organ of Corti.Acta-oto-laryngologica89. 376-383.
- 105.M Erre J- P, Guilhaume A. (1980) Acoustic responses after total destruction of the cochlear receptor: brainstem and auditory cortex.Science210. 83-86.
- 106.Cazals Y, Aran J- M, Erre J- P. (1982) Frequency sensitivity and selectivity of acoustically evoked potentials after complete cochlear hair cell destruction.Brain Res23. 197-203.
- 107.Cazals Y, Aran J- M, Erre J- P, Guilhaume A, Aurousseau C. (1983) Vestibular acoustic reception in the guinea pig: a saccular function?Acta -oto– laryngological95. 211-217.
- 108.Didier A, Cazals Y. (1989) Acoustic responses recorded from the saccular bundle on the eighth nerve of the guinea pig.Hear Res37. 123, 10-1016.
- 109.Murofushi T, I S Curthoys, A N Topple, J G Colebatch, G M Halmagyi. (1995) Responses of guinea pig primary vestibular neurons to clicks. Exp Brain Res 103, 174 – 178. https://doi.org/ 10.1007/BF00241975 .
- 111.Sohmer H, Elidan J, Plotnik M, Freeman S, Sockalingam R. (1999) Effect of noise on the vestibular system – vestibular evoked potential studies in rats.Noise. Health2, 41 – 51 .
- 112.I S Curthoys, J W Grant, C J Pastras, Frohlich L, D J Brown. (2021) Similarities and differences between vestibular and cochlear systems – a review of clinical and physiological evidence.FrontNeurosci15. 695179-10.
- 115.G V Bekesy. (1948) Vibration of the head in a sound field and its role in hearing by bone conduction.JAcoustSoc Am20. 749-760.
- 116.Zwislocki J. (1953) Acoustic attenuation between the ears. , J Acoust Soc Am 25,752 – 759, 10-1121.
- 117.E K Franke. (1956) Response of the human skull to mechanical vibrations.JAcoustSoc. Am28, 1277 – 1284-10.
- 118.Tonndorf J, A F Jahn. (1981) Velocity of propagation of bone-conducted sound in a human head.JAcoustSoc. Am70, 1294 – 1297-10.
- 119.Stenfelt S, R L Goode. (2005) Bone-conducted sound: physiological and clinical aspects. , Otol Neurotol 26, 1245-1261.
- 120.R L Goode. (2005) Transmission properties of bone conducted sound: measurements in cadaver heads.JAcoustSoc. Am118, 2373 – 2391-10.
- 121.Stenfelt S. (2011) Acoustic and physiologic aspects of bone conduction hearing.AdvOtorhinolaryngol71,10. 21, 10-1159.
- 122.M D Hall, Gaston J. (2019) Individual differences in the acoustic properties of human skulls. , J Acoust Soc Am 146, EL 191 - EL 197, 10-1121.
- 123.Broek S P Van den, Reinders F, Donderwinkel M, M J Peters. (1998) . Volume conduction effects in EEG and MEG.ElectroencephalogrClinNeurophysiol106, 522 – 534 10-1016.
- 124.G T Clement, Hynynen K. (2002) Correlation of ultrasound phase with physical skull properties.Ultrasound. MedBiol28, 617 – 624-10.
- 125.Mauldin L, Jerger J. (1979) Auditory brain stem evoked responses to bone-conducted signals.ArchOtolaryngol105. 656-661.
- 126.Martini A. (1983) Air and bone conduction brain stem responses in adults and infants.Audiology22. 430-437.
- 127.Boezeman E H J F, T S Kapteyn, S L Visser, A M Snel. (1983) Comparison of the latencies between bone and air conduction in the auditory brain stem evoked potential.ElectroencephalogrClinNeurophysiol56. 244-247.
- 128.R G Hooks, B A Weber. (1984) Auditory brainstem responses of premature infants to bone-conducted stimuli: a feasibility study.Ear Hear5. , 42 – 46.
- 129.E Y Yang, A L Rupert, Moushegian G. (1987) A developmental study of bone conduction auditory brain stem response in infants.Ear Hear8. 244-251.
- 130.M P Gorga, J R Kaminski, K L Beauchaine, B M. (1993) A comparison of auditory brain stem response thresholds and latencies elicited by air- and bone- conducted stimuli.Ear Hear14. , 85 – 94.
- 131.R K Neeman, Hildesheimer M. (1995) Auditory brainstem response to bone-conducted clicks in adults and infants with normal hearing and conductive hearing loss.ScandAudiol24. 185-191.
- 132.Turkman T, Kaygusuz I, Basar F, Karlidag T, Keles E. (2018) Normalization of bone conduction auditory brainstem evoked responses in normal hearing individuals.J Int. AdvOtol14 418.
- 133.Kim S. (2018) Update on bone-conduction auditory brainstem responses: a review. , J audiol Otol 22, 10-7874.
- 134.V D Larson. (1985) Spectral characteristics of air and bone conduction transducers used to record the auditory brain stem response.Ear Hear6. 274-277.
- 135.N A Shaw. (1990) The brainstem auditory evoked potential: effects of high frequency filtering. , Electromyogr Clin Neurophysiol 30, 159-163.
- 136.N A Shaw. (1991) A possible thalamic component of the auditory evoked potential. in the rat.Brain Res Bull27, 133 – 136 10-1016.
- 137.N A Shaw. (1993) Auditory evoked potentials recorded from different skull locations in the rat.Int JNeurosci70. 277-283.
- 138.N A Shaw. (1995) The effects of low-pass filtering on the primary cortical auditory potential of the rat.JNeurosciMethods59. , 209 – 216, 10-1016.