
Evolution of the Solid Human Tumor Cells Properties in Various Experimental Systems in Vitro
Abstract
Background
Human malignant cell models which reflect the structural and physiological complexity of tumor tissue are of great importance for preclinical research in oncology. Spheroids/tumoroids derived from solid tumors are of great interest as cellular models mimicking the first vascular-free growth phase of a tumor node. The fact of the identity between artificially created tumor multicellular aggregates and the real tumor tissue, however, needs to be specified, described and validated in order to see how closely the spheroids are biologically similar to the malignized tissues in vivo compared to the monolayer cell cultures traditionally used. We present here a comparison study of the characteristics of solid tumor cells of different histogenesis (melanomas, soft tissue sarcomas and bone sarcomas, epithelial tumors) cultured in two dimensions (monolayer culture) and three dimensional space (spheroid), namely: spatial organization, multiplication, metabolic activity.
Patients and Methods
For the creation of 2 D and 3D cell models the cells isolated from the patient's solid tumor fragments obtained intraoperatively were used. 15 samples of skin melanoma, 20 samples of soft tissue and osteogenic sarcomas (STBS), and 9 samples of epithelial tumors (ET). The tumor cells were all cultivated for at least 10 passages. We used phase contrast, confocal microscopy, and immunohistochemistry to investigate spheroids and monolayer cultures. The supernatants of tumor cells grown in 2D and 3D cultures were studied using ELISA and multiplex analysis for the production of a spectrum of chemokines and cytokines supporting the immunosuppression, invasion and metastasis processes.
Results
Tumor specimens received were predominantly of metastatic origin (75%). In 100% of cases 2D cultures were received, in 88.6% of cases (39 out of 44) we succeeded in obtaining spheroids. There was no direct correlation between the efficiency of tumoroid formation and the tumor's histogenetic origin and the stage of the cancer process (primary tumor, recurrence, metastasis). The median size of spheroids by 4-5 days of cultivation with a starting concentration of 10000 cells per well was 657.14 μm for melanoma (min 400 - max 1000 μm), 571.42 μm (min 400 - max 700 μm), 507.14 μm (min 300 - max 600 μm) for soft tissue sarcomas, 650.0 μm (min 400 - max 900 μm) for osteogenic sarcomas. Immunochemical analysis of Ki-67, GLUT1, and Ecadherin markers was carried out for tumor tissue samples, single-layer tumor cultures, and tumoroids of every patient. The distribution of the stained groups in the spheroids was distinct from the monolayer cultures and more in accordance with the distribution of such in the tissue tumor, the number of Ki-67+ cells was increasing in the spheroids. We detected no dependence of Ki-67+ and GLUT1+ cell localization grade on spheroid size. We identified E-cadherin in tumor tissue and tumoroids of breast carcinoma and one melanoma culture. Monolayer cultures did not express it. The increase in secretory cell activity of the solid tumor cells from 2D to 3D system was observed when CCL2, CCL3, CXCL1, CXCL16, MIF, IL10, MICA (p<0.01) were investigated.
Conclusion
The presence of patient-specific cells of solid tumors in a 3D environment causes activation of the proliferative and metabolic processes as compared to monolayer cultures, which makes these models approximate the real world clinical picture. The production of chemokines that can attract to the tumor various types of immune system cells, to include their immature versions, as well as production of cytokines and Immunosuppression factors that, when present in the tumor microenvironment in the high concentrations, contribute to the formation of immune cells having suppressive capacities occurs in the 3D cell system. Three-dimensional model of the initial tumor nodule formation stage thus demonstrates the forming process of tumor cells favorable for them microenvironment. Construction of three-dimensional models - spheroids of tumor cells of differing histogenesis demands individual approach and more thorough investigation.
Author Contributions
Copyright © 2022 Anna B. Danilova, et al.
 This is an open-access article distributed under the terms of the Creative Commons Attribution License, which permits unrestricted use, distribution, and reproduction in any medium, provided the original author and source are credited.
Competing interests
The authors have declared that no competing interests exist.
Citation:
Introduction
Solid tumors have a complex three-dimensional (3D) spatial structure, including many non-tumoral cells and the extracellular matrix, which together make up the malignant tumor microenvironment 1. Thereby tumor cells are usually in suboptimal growth conditions, such as hypoxia or reduced nutrient concentration, and are affected by intercellular contacts and/or various signals from the microenvironment. In conventional two-dimensional (2D) single-layer cultures, most of these "environmental" signals are absent. Hence there is no microenvironment exposure, and the biological characteristics of the original malignancy may be lost due to the cellular adaptation required for survival in vitro 2, 3. 2D cells cultures are exposed to a homogenous environment: growth factors, nutrients, oxygen, and CO2 4. Conversely, cells in solid tumors are exposed to different gradients of biochemical molecules and biological signals, which can both stimulate and inhibit tumor progression 5.
It is now well known that in 3D structures, in addition to the possible chemical gradient's induction, three-dimensional intercellular interaction itself affects the properties of tumor cells. It includes cell structure, adhesion, mechanotransduction, and signal transduction in response to soluble factors, which in turn, regulate the general functions of cells. Altogether it is fundamentally different from traditional 2D cultivation systems 6.
Many researchers believe that the growth kinetics of in vitro tumoroids (microsized cell spheroid aggregates) are similar to the growth kinetics of solid tumors. The initial growth period of solid tumors is called the vasculinless growth phase, during which the tumor volume increases exponentially. It is followed by a quiescent state, and a phase of new vessel formation caused by angiogenic factors 7. As the spheroids grow, their volume increases exponentially. When they reach a size of 200-500 µm in diameter the growth rate decreases and plateaus. Thus, spheroids' growth corresponds to the initial growth phase of the tumor node 8. Tumor spheroids are used for in vitro modeling of malignant neoplasms to mimic their properties. Such models are best developed for epithelial tumors: lung cancer 9 , cervical 8 , pancreatic 10, prostate 11, breast 12 , colorectal cancer 13. Skin melanoma spheroids are being developed for more than 10 years 14 . Relatively recently, 3D cellular models for the sarcoma’s studies have begun to be developed 15 . Thus, interest in 3D modeling to study the malignant neoplasms properties has been around for quite some time. But, the more detailed and extensive characterization and validation of spheroids as 3D cancer models are still needed to understand how close they are in biological properties to malignant tissues in vivo, including structure, growth kinetics, gene expression, signaling pathways, and response to therapy 6, 16.
In addition, the use of 3D models will allow all-important tumor characteristics to be taken into account to determine individual patient treatment tactics. This approach will facilitate the study of individual biological features of the tumors and the understanding of cancer biology in general. Here we present a comparative study of the properties of different histogenesis solid tumors cells (melanomas, soft tissue sarcomas, and osteogenic sarcomas, epithelial tumors) cultured in 2D (monolayer culture) and 3D (spheroid), namely, formation features, spatial organization, proliferation, metabolic activity, and cell motility.
Materials and Methods
Tumor tissue fragments surgically obtained from patients treated at N.N. Petrov National Medicine Research Center of Oncology in 2015-2020 were used as the material for cell cultures: 15 skin melanoma samples, 20 soft tissue and bone sarcoma (STBS) samples (7 osteogenic sarcomas), 1 chondroblastic osteosarcoma, 4 synovial sarcomas, 3 myxofibrosarcomas, 1 pleomorphic liposarcoma, 1 embryonal rhabdomyosarcoma, 1 leiomyosarcoma, 1 alveolar sarcoma, 1 schwannoma) and 9 epithelial tumor samples (3 colorectal cancer, 2 renal cancer, 2 breast cancer, 1 non-small cell lung cancer, 1 bladder cancer). The study protocol was approved by the ethical committee of the Research Centre, all enrolled patients or their legal representatives gave written informed consent to obtain tumor tissue samples during surgery. Tissue samples were stored in accordance with the Declaration of Helsinki and used in accordance with the Human Tissue Act of 2004. The histological verification of the tumors and their localization are presented in Table 1
Table 1. Histological verification of patient’s tumor samples| tumor | primary | recurrence | metastatic | total | ||
| melanoma | ||||||
| melanotic | spindle cell | 1 | 0 | 1 | soft tissue (1) | 2 |
| epithelioid cell | 0 | 0 | 3 | lymph nodes (3) | 3 | |
| amelanotic | spindle cell | 0 | 1 | 0 | 0 | 1 |
| epithelioid cell | 1 | 1 | 7 | soft tissue (3) | 9 | |
| lymph nodes (2) | ||||||
| thyroid (1) | ||||||
| breast(1) | ||||||
| STBS subtype | ||||||
| osteosarcoma | 0 | 0 | 7 | lung (7) | 7 | |
| chondroblastic osteosarcoma | 0 | 0 | 1 | lung (1) | 1 | |
| pleomorphic liposarcoma | 0 | 0 | 1 | lung (1) | 1 | |
| sinovial sarcoma | 0 | 2 | 2 | lung (2) | 4 | |
| myxofibrosarcoma | 1 | 1 | 1 | soft tissue (1) | 3 | |
| leiomyosarcoma | 0 | 0 | 1 | lung (1) | 1 | |
| rabdomyosarcoma | 0 | 0 | 1 | lung (1) | 1 | |
| alveolar sarcoma | 0 | 0 | 1 | lung (1) | 1 | |
| schwannoma | 0 | 0 | 1 | lung (1) | 1 | |
| epithelial tumors | ||||||
| renal cancer | 1 | 0 | 1 | lung (1) | 2 | |
| colorectal cancer | 0 | 0 | 3 | lung (2) | 3 | |
| extraperitoneal (1) | ||||||
| breast cancer | 1 | 0 | 1 | colon (1) | 2 | |
| bladder cancer | 0 | 1 | 0 | 0 | 1 | |
| lung cancer | 0 | 0 | 1 | pleural cavity (1) | 1 | |
| Total | 5 | 6 | 33 | 44 | ||
Monolayer tumor cells cultures. Freshly obtained tumor samples were mechanically disaggregated using Medimachine (Agilent Dako, USA) and passed through Filcon filter system with pore size 70 μm and 50 μm (BD Biosciences, USA). The cells were plated in DMEM/F12 media supplemented with 20% fetal bovine serum (FBS), glutamine (365 mg/l), insulin (5 μg/ml), transferrin (5 μg/ml), selenium (5 ng/ml) (Termo Fisher Scientific, CША), penicillin (100 UI/ml), streptomycin (100 μg/ml) (Sigma, CША). The tumor cells were cultured at 37 ◦C, 5% CO2, and 100% humidity in plastic flasks following the Freshney method 17 with our modifications 18. Adherent cells were subcultured after detachment using 0.25% trypsin (Invitrogen, USA) and10 mM ethylenediaminetetraacetate EDTA solution (Sigma–Aldrich, USA). Tumor cell cultures were cultivated continuously at least for 10 passages.
Tumor Spheroids (Tumoroids)
Spheroids were obtained using a liquid overlay technique with a 96-well black plate with glass bottom Ultra-Low Attachment Surface (Corning, USA). Typically, 10,000 cells in 200 μl of complete nutrient medium were placed in the plate wells. Tumoroids were cultured in Heracel CO2 incubator (Thermo Electron LTD GmbH, Germany) for 3 to 8 days depending on the cell line at 37ºC, in a humid atmosphere with a 5% CO2 level. During cultivation, the medium was changed on day 3. At the end of cultivation, spheroids were washed in PBS solution (pH 7.4) for further manipulations.
Structure of Spheroids
Confocal microscopy techniques were used to study spheroids' structure. The washed spheroids were fixed with 10% buffered formaldehyde and stored at 4ºC for 24 h, and further stained with fluorescent dyes Phalloidin-Alexa488/PI at concentrations of 2 µM and 4 µM, respectively 19. After staining, spheroids were washed in PBS, embedded in glycerol, and imaged using a Zeiss LSM 710 confocal microscope (Zeiss, Germany), with two-channel + Z-stack viewing on an x40 objective (Plan-Apochromat 40x/1.4). Exposure time was 100-200 ms with filters Phalloidin-Alpha 488 - 488 nm, for PI - 546 nm. The images obtained were analyzed using ZEN Microscope Software 2.1 on Windows7-64-bit (Zeiss, Germany).
Histological and Immunohistochemical Processing
Spheroids were fixed with 10% buffered formaldehyde at 4 °C for 24-36 h, then placed in 4% agar (Difco, USA), dehydrated with absolute isopropyl alcohol, and embedded in paraffin (Histomix, Biovitrum, RF). Serial paraffin sections no thicker than 4 μm using an SM2000R microtome (Leica, Germany) were made. Every tenth slice was stained with Meyer's hematoxylin and eosin for object detection.
Malignified cells grown in a monolayer on culture glasses under standard conditions were fixed in absolute acetone for 2-3 min, air-dried, placed in airtight containers, and stored at -20°C until use.
Tumor tissue samples were fixed with 10% buffered formalin for 24 hours, dehydrated with absolute isopropyl alcohol, and embedded in paraffin (Biovitrum, Russia). Paraffin blocks of tumor tissue were treated as described above. Material from 10 patients was included in the study.
Ki-67, GLUT-1, and E-cadherin antigen detection were performed in paraffin sections of tumor tissue, monolayer tumor cultures, and tumoroids. GLUT1 Rabbit Polyclonal Antibody (Abcam, USA), Cadherin Mouse monoclonal antibody and Ki-67 Mouse Monoclonal Antibody (Diagnostic BioSystems, USA) were used as primary antibodies. EnVision FLEX HRP (Aglient Dako, Denmark) was used as a secondary antibody. The preparations were stained with hematoxylin (Ventana Medical Systems, Inc., Germany).
Digital images were obtained using a Digital scanning microscope Panoramic 1000 (3DHISTECH Ltd., Hungary). Lens: Carl-Zeiss Plan-Apochromat 40×Corr / NA 0.95. Camera: Adimec QUARTZ Q-12A180 with resolution 69 Mp/mm2, using CaseViewer 2.2.1 software (3DHISTECH Ltd., Hungary).
Elisa
Supernatants of monolayer cell cultures (2D) and spheroids (3D) were tested. Conditioned medium was collected 7 days after the beginning of cultivation. Tumor cell culture supernatants were stored at -20°C and thawed at 4°C immediately before determining the concentration of the test substances. Sandwich-type enzyme-linked immunosorbent assay Duoset ELISA Kit (R&D Systems, USA) was used to detect NKG2D receptor-ligand of cytotoxic Tlymphocytes and natural killer MICA. The optical density in each well was measured at 450 nm using a Thermo Scientific Multiscan EX microplate reader (Thermo LabSystems Inc., USA). Transformation Growth factor β1 (TGF β1) was detected with Bender MedSystems GmbH, Austria.
Multiplex Analysis
A Bio-Plex® 200 multiplex analyzer (Bio-Rad, USA) and a Bio-Plex Pro™ Human Chemokine Panel, 40-Plex (Bio-Rad, USA) were used to detect major cytokines and chemokines in supernatants of 2D and 3D tumor cell cultures. The concentrations of the following analytes were analyzed: 6Ckine/CCL21, BCA1/CXCL13, CTACK/CCL27, ENA-78/CXCL5, Eotaxin/CCL11, Eotaxin-2/CCL24, Eotaxin3/CCL26, Fractalkine/CX3CL1, GCP-2/CXCL6, GM-CSF, Gro-α/CXCL1, Gro-β CXCL2, I309/CCL1, IFN-ϒ, IL-1β, IL-2, IL-4, IL-6, IL-8/CXCL8, IL-10, IL-16, IP-10/CXCL10, ITAC/CXCL11, MCP-1/CCL2, MCP-2/CCL8, MCP-3/CCL7, MCP-4/CCL13, MDC/CCL22, MIF, MIG/CXCL9, MIP-1α/CCL3, MIP-1δ/CCL15, MIP-3α/CCL20, MIP-3β/CCL19, MPIF1/CCL23, SCYB16/CXCL16, SDF-1α+β/CXCL12, TARC/CCL17, TECK/CCL25, TNF-α.
Statistical Analysis
Data were statistically analyzed using Wilcoxon W-test for connected samples. Differences were considered statistically significant at p<0.05 For data storage, processing, statistical analysis, and visualization Microsoft Excel 2019 (Microsoft Corporation, USA) was used. Systematization, statistical analysis, and data visualization were performed using R v. 4.0.1. 20
Results
Tumor cell cultures. As a result of tumor fragments disaggregation, 15 cultures of skin melanoma, 20 STBS cultures, 8 cultures of epithelial tumors cells were obtained, as described in the "Materials and Methods" section. Seventy-five percent of the samples were of metastatic origin (33 of 44), 11.4% were obtained from the primary tumor (5 of 44) and 13.6% were from recurrent disease (6 of 44). Morphologically, all the obtained tumor cultures were highly heterogeneous within the same histological type (Figure 1, I).
Figure 1.Мorphology of the established solid tumor cell cultures and spheroids I-monolayer tumor cell cultures, II-spheroids composed of tumor cells (monospheroids). 1, 2 – alveolar sarcoma #927, 10 passage; 3, 4 – melanoma #860, 35 passage; 5, 6 – leiomyosarcoma #699, 16 passage; 7, 8 – melanoma #912, 25 passage; 9, 10 – rhabdomyosarcoma #862, 20 passage; 11, 12 – melanoma #929, 51 passage; 13, 14 – synovial sarcoma #716, 25 passage; 15, 16 – renal cancer #584, 40 passage; 17, 18 – myxofibrosarcoma #728, 19 passage; 19, 20 – colon cancer #485, 12 passage; 21, 22 – osteosarcoma #921, 12 passage; 23, 24 – bladder cancer #875, 15 passage. Inverted microscope, phase contrast, 100 µm scale value.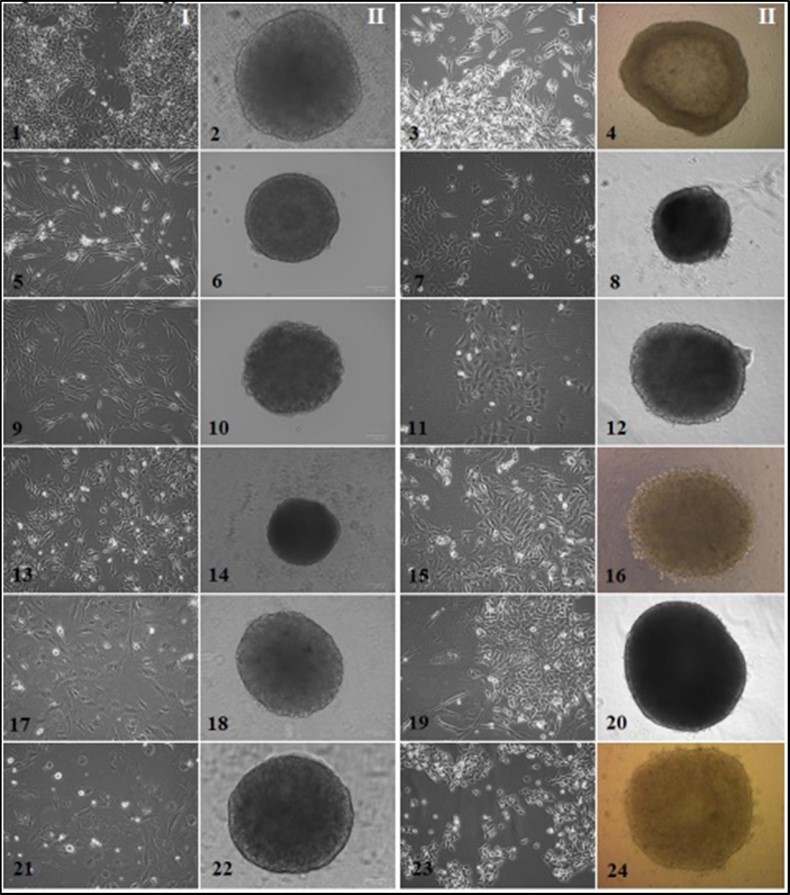
Adhesion growth was typical for all tumor cultures except breast cancer culture # 973, with a semi-suspension growth type that tended to spontaneously form rounded cell aggregates resembling spheroids.
Spheroid formation. During the Liquid overlay technique cultivation, three stages of spheroid formation were observed. For 1-2 days the tumor cells formed disc-like structures at the bottom of the well. On days 2-3, they united into unstable cell aggregates with uneven edges, which could be destroyed by any physical impact. On days 3-5, the aggregates gained cell mass and, as a rule, formed a dense rounded spheroid with smooth edges (Figure 2). In 88.6% of cases (39 out of 44), spheroids suitable for further manipulations were obtained.
Figure 2.Stages of spheroid formation 1 - formation of tumor cells disc on the bottom of the well; 2 - aggregation of tumor cells; 3 - compaction and growth of tumor cells. melanoma cell culture #912, 33 passage. Zeiss Primo Vert phase contrast microscope (10x 0.25 Ph1). The scale bar is 100 µm.
Direct dependence of tumoroid formation efficacy on the histogenesis of tumor cells and the stage of the carcinogenesis the material was taken (primary tumor, relapse, metastasis) was not revealed. The process had an individual character and depended on the internal properties of particular cell culture. Among the cultured melanoma cells (MC), only in one (6.7%) aggregation was not observed; 5 cultures demonstrated the formation of loose, weakly stable spheroids (33.3%); in some cases, the cell aggregate retained rather a disk-like rather than a spherical shape. The rest of MC samples (60%) formed dense stable spheroids, often with a well-defined marginal zone (Figure 1-4, 1-8, 1-12). Generally, STBS cells showed response to induced aggregation and quickly formed dense stable spheroids (95%) (Figure 1-2, 1-6, 1-10, 1-14, 1-18, 1-22), except for pleomorphic liposarcoma # 702, which grew on a low-adhesive surface in separate aggregates up to 30 microns in diameter and disintegrated due to medium change or spheroid transferring. Among epithelial tumor cells, a third of the cultures did not form tumoroids, including 1 kidney cancer culture #291 and 2 colorectal cancer cultures. Kidney cancer culture # 291 formed loose unstable spheroids (Figure 1-16). Breast cancer cells # 973 had a semi-suspension growth pattern and were prone to spontaneous aggregation, that is, they existed in culture as conglomerates of 50-400 cells. To obtain tumoroids from this culture, native spheroids were disintegrated at a given starting inoculum concentration, then cell suspension was placed in a drop or added to a culture plate. However, the newly formed small aggregates disintegrated within 1–2 days. Combining several native spheroids in one drop or plate well resulted in the formation of one large spheroid. At the same time, another breast cancer culture # 512 showed a pronounced adhesive growth in a monolayer and formed a dense spheroid with smooth edges.
The average size of spheroids by 4-5 days of cultivation with a starting concentration of 10,000 cells per well was 657.14 μm for melanoma (min 400 - max 1000 μm), 571.42 μm for soft tissue sarcomas (min 400 - max 700 μm), 507.14 microns for osteogenic sarcomas (min 300 - max 600 microns), and 650.0 microns for epithelial tumors (min 400 - max 900 microns).
Spheroidal organization. According to confocal microscopy, the structural organization of spheroids from different histogenesis tumor cells had similar features (Figure 3).
Figure 3.Confocal microscopy analysis of tumoroids’ structure A – melanoma cell culture #912, B – myxofibrosarcoma cell culture #728, C –leiomyosarcoma cell culture #699, D – melanoma cell culture #226, E – breast cancer cell culture #973. PI - Propidium iodide (red, nuclei), Phalloidin-Alexa-488 (green, F-actin). Legend: arrow 1 indicates inner spheroid layer and F-actin outgrowths, arrow 2 indicates proliferating rounded cells at the spheroid periphery, arrow 3 indicates stained nuclei. Scale bar is 50 µm for cell cultures #699, #728, #226, 100 µm for cell culture #912, #973.
In the central zone of tumoroids, cells showed a typical mesenchymal morphology, characterized by an elongated form and rich F-actin outgrowths, traced throughout the tumoroid. On the periphery, there were predominantly rounded proliferating cells without outgrowths, but with increased F-actin expression, which may indicate a high potential for invasion. Different intensity of F-actin expression was found in tumoroids of various origins, and it was least expressed in STBS spheroids (Figure 3).
Proliferative and metabolic features of tumor cells in 2D and 3D experimental systems.
Immunochemical analysis of Ki-67 (cell proliferation marker), GLUT1 (unidirectional glucose transporter), and E-cadherin, (intercellular contacts) was carried out in tumor tissue samples, monolayer cultures, and tumoroids of each patient.
Analysis of monolayer tumor cultures preparations stained with Mayer's hemalaun and eosin showed that the cultured tumor cells were well spread and occupied a significant area (Figure 4). Tumoroids structure largely reproduced the structure of tumor tissue in vessels free areas. Peripheral spheroid cells were round in shape, and closer to the center cells were more compact, since the space was limited by neighboring cells and the extracellular matrix.
Figure 4.Identification of Ki-67, GLUT1, E-cadherin in solid tumor cells from different experimental systems. A - #921 osteosarcoma, 10 passage, spheroid ⊘ 752.7 μm; B - #912 melanoma, 19 passage, ⊘ 683 μm; C - #982 myxofibrosarcoma, 33 passage, ⊘ 611.8 μm; D - #973 breast cancer, 27 passage, ⊘ 690 μm. Monolayer culture - 20 μm scale bar; spheroid - 100 μm scale bar; tumor tissue - 20 μm scale bar. From left to right: hematoxylin-eosin staining; proliferative activity marker Ki-67; GLUT1 - glucose transporter protein; cell adhesion protein E-cadherin. different experimental systems.
The distribution of Ki-67+ and GLUT1+ cells in the spheroid structure was individual even within tumors of similar histogenesis, in particular, in the spheroids of myxofibrosarcoma, osteosarcoma, and melanoma (Table 2, Figure 4). At the same time, the distribution of stained cells in the spheroids differed from the monolayer culture and was more consistent with the distribution of those in the tumor tissue. No dependence in Ki-67+ and GLUT1+ cells localization on the spheroid size was found (Table 2).
Table 2. Comparative analysis of the detection of markers of proliferation, metabolic activity and intercellular contacts in different cell systems in vitro and in vivo| Culture | Spheroid diameter, μm | ANTIGENS | ||||||||
| KI-67 (% stain cells) | GLUT1 (+present/-absent) | E-cadherin (+present/-absent) | ||||||||
| tumor | 2D | 3D/localisation | tumor | 2D | 3D/localisation | tumor | 2D | 3D | ||
| #699leiomyosarcoma | 310,8 | 22 | 10 | 15diffuse | + | - | +diffuse | - | - | - |
| #862 rabdomyosarcoma | 612 | 12 | 5 | 14diffuse | ± | - | ++spheroid centre | - | - | - |
| #716 synovialsarcoma | 620,7 | 65 | 70 | 78spheroid centre | + | - | +spheroid centre | - | - | - |
| #728myxofibrosarcoma | 550,6 | 25 | 12 | 35diffuse | + | - | +spheroid centre | - | - | - |
| #982myxofibrosarcoma | 611,8 | 45 | 18 | 78diffuse | ++ | ± | ++diffuse | - | - | - |
| #793osteosarcoma | 417,2 | 52 | 10 | 12diffuse | ± | - | ±diffuse | - | - | - |
| ОС #921osteosarcoma | 752,7 | 48 | 5 | 45spheroid periphery | + | - | ++spheroid centre | - | - | - |
| #912 melanoma | 683 | 67 | 80 | 85 - spheroid periphery | ++ | - | ++spheroid centre | - | - | - |
| 10 – spheroid centre | ||||||||||
| #929 melanoma | 680,8 | 45 | 25 | 55diffuse | ++ | ± | ±diffuse | + | - | ± |
| #973 breast cancer | 690 | 88 | no data | 93diffuse | +++ | no data | +++diffuse | ++ | no data | ++ |
The number of Ki-67+ cells in monolayer cultures was lower than in spheroids and/or in tumor tissue. In most cases, an increase in the number of Ki-67+ cells correlated with an increase in the tumoroid size. It can be assumed that the presence of spheroid architecture, more complex in comparison with monolayer cultures, as well as the presence of a nutrient gradient, and necrotic nucleus inside, increases the expression of this factor. In spheroids, peripheral localization of Ki67+ cells (Table 2) was observed in 2 cases out of 10 (melanoma #912 and osteosarcoma #921); central localization - in 1 case out of 10 (synovial sarcoma culture #716) and diffuse - in 7 cases out of 10.
It is assumed that tumoroids can represent a model of a hypoxic niche of tumor cells in vitro. Increased hypoxia in tumors induces GLUT-1 protein expression, carrying out unidirectional glucose transport across the plasma membrane. GLUT-1 expression in tumor spheroids and tumor tissue was found. No GLUT-1 expression in all monolayer samples was revealed, except in melanoma #929, where weak cytoplasm staining in 7% of cells was observed.
In several cases, GLUT-1 gradient distribution in spheroids was revealed (Table 2, Figure 4 A, B). At the same time, GLUT-1 + mycofibrosarcoma and breast cancer cells had a diffuse distribution inward tumoroid, despite its significant size (> 600 µm in diameter) (Figure 4 C, D). The intensity of GLUT-1 expression, assessed by the intensity of the immunocytochemical reaction, depended on the spheroid size: the larger the size, the more pronounced the staining was. In particular, in melanoma #912 spheroid, a decrease in staining intensity from the center to the periphery was observed (Fig. 4B). Such a distribution of GLUT-1 may indicate a decrease in glucose concentration from the periphery to the center of the tumoroid. The increased GLUT-1 expression in tumor spheroids demonstrates the change in glucose metabolism in 3D cultured tumor cells as compared to 2D, which brings the considered 3D cell models closer to tumor tissue.
E-cadherin in breast cancer #973 tumor tissue and tumoroids was revealed (Table 2, Figure 4D). E-cadherin was also detected in MC #929 tumor tissue; very weak staining was observed in the tumoroid, while the monolayer culture did not express it. In other cases, E-cadherin was not detected.
Secretory functions in spheroids cells. Statistically significant differences in the secretory activity in 2D and 3D cultures of solid tumor cells in CCL2 study were observed (a powerful factor of monocyte chemotaxis in mammals). CCL2 mean concentration in the conditioned medium of spheroids was 1707.16 pg/ml (min 150.74 - max 6316.8), while in the supernatant of monolayer cultures - 848.79 pg/ml (min 4.91 - max 1973.08); p = 0.04126 (Figure 5-1). There were also statistically significant differences in CCL3 production (macrophage inflammatory protein 1- alpha, involved in acute inflammation, in the recruitment and activation of polymorphonuclear leukocytes by binding to CCR1, CCR4, and CCR5 receptors): 1.82 pg/ml (min 0, 11 - max 20.24) compared to 3.88 pg/ml (min 1.10 - max 1230.28) in the monolayer and tumoroids, respectively (p = 0.00427) (Figure 5-2).
Figure 5.Graphical representation of individual differences in chemokine and cytokine production of 2D and 3D tumor cells cultures. Abscissa: cultivation conditions (2D and 3D), ordinate: concentration of test substance in tumor cell culture supernatants, pg/ml. 1 - MCP-1 / CCL2, p=0.04126; 2 - MIP-1α / CCL3, p=0.00427; 3 - SCYB16 / CXCL16, p=0.00427; 4 - Gro-α / CXCL1, p=0.0105; 5 - MIF, p=0.00854; 6 - IL-10, p=0.00006; 7 - MICA, p=0.00001.
MIF secretion (a factor inhibiting macrophages migration, an evolutionarily ancient cytokine that regulates many processes in the body, i.e., inflammation) also changed depending on the cultivation conditions: 33.55 ng/ml (min 30.84 - max 82.66) in 2D cultures up to 62.05 ng/ml (min 37.69 - max 175.31) in spheroids (p = 0.00854) (Figure 5-5)
A statistically significant increase in Interleukin 10 (IL10) expression (plays a role in tumor-induced immunosuppression) was observed in 3D culture compared to the monolayer: the median was 116.71 pg/ml (min 7.70 - max 649.19) and 17.32 pg/ml (min 1.42 - max 107.39), p = 0.00006, respectively (Figure 5-6). Statistically significant increase in MICA production in 3D cultures: 363.55 pg/ml (min 57.68 - max 3537.5) compared to the monolayer: 90.2 pg/ml (min 15.63 - max 1818.5) was found, p = 0.00001(Figure 5-7).
Studying the remaining analytes, no statistically significant differences were found in general, but individual analysis showed interesting features for tumor cells in individual patients. An almost 4-fold increase in chemokine CCL21 level, which under normal conditions is a chemoattractant for naive T-lymphocytes possessing CCR7 receptor, was found in spheroid supernatants of myxofibrosarcoma #728 (2D / 3D - 246.61 / 891.25 pg/ml). An increase in CCL21 concentration in kidney cancer # 291 tumoroids was observed (2D / 3D - 357.76 / 428.64 pg/ml). Chemoattractant for B-lymphocytes CXCL13 was detected in high concentrations in the supernatants of myxofibrosarcoma #728 and lung cancer #1014 cultures (Table 3). Interestingly, among all studied cultures, spheroids #728 demonstrated an increase in the production of almost all homeostatic and inflammatory chemokines (Table 3). Also, according to the intensity of the increase in the specific synthetic functions under consideration during the transition from monolayer culture to tumoroids, lung cancer cell cultures #1014, rhabdomyosarcoma #862, and melanoma #916 were noted. All these malignant cells cultures were obtained from metastatic formations, the tumor process was aggressive, tumors were resistant to standard therapies, which led to the rapid death of the patients.
Table 3. Homeostatic and inflammatory chemokines/cytokines content in supernatants of individual 2D and 3D human solid tumour cell models| Analytes, pg/ml | Cultures | |||||||
| #728 | #1014 | #862 | #916 | |||||
| 2D | 3D | 2D | 3D | 2D | 3D | 2D | 3D | |
| CCL1 | 28,7 | 86,6↑ | 288,6 | 51,5 | 38,3 | 38,6↑ | 71,7 | 74,9↑ |
| CCL2 | 37,9 | 6316,8↑ | 3032,5 | 1006,9 | 7338,5 | 2522,1 | 2618,1 | 2582,9 |
| CCL3 | 9,1 | 1230,3↑ | 16,3 | 42,9↑ | 1,3 | 1,9↑ | 3,1 | 11,7↑ |
| CCL7 | 33,3 | 358,1↑ | 542,2 | 4323,8↑ | 702,2 | 4458,9↑ | 194,7 | 210,7↑ |
| CCL8 | 0,58 | 3620,3↑ | 697,4 | 632,5 | 6302,6 | 158,6 | 2,5 | 2,7↑ |
| CCL11 | 10,8 | 33,6↑ | 37,6 | 24,6 | 224,6 | 45,5 | 25,7 | 24,9 |
| CCL13 | 67,4 | 117,7↑ | 376,9 | 223,7 | 379,1 | 273,6 | 106,6 | 71,9 |
| CCL15 | 11,6 | 580,7↑ | 357,4 | 58,9 | 14,6 | 15,6↑ | 127,1 | 154,7↑ |
| CCL17 | 7,1 | 57,3↑ | 64,9 | 20,8 | 15,03 | 16,1 | 26,1 | 27,8↑ |
| CCL19 | 46,9 | 190,2↑ | 199,8 | 155,8 | 235,8 | 99,5 | 141,4 | 131,5 |
| CCL20 | 11,8 | 6300,3↑ | 28,9 | 443,1↑ | 4,7 | 106,2↑ | 2177,8 | 3730,8↑ |
| CCL21 | 246,6 | 891,3↑ | 620,7 | 535,2 | 446,5 | 468,4↑ | 743,9 | 767,9↑ |
| CCL22 | 15,3 | 251,2↑ | 4954,3 | 194,1 | 148,6 | 32,9 | 30,7 | 28,4 |
| CCL23 | 4,3 | 24,5↑ | 490,1 | 25,4 | 8,6 | 9,3↑ | 19,3 | 19,3 |
| CCL24 | 45,8 | 77,5↑ | 617,6 | 73,4 | 48,8 | 56,2↑ | 69,4 | 65,1 |
| CCL25 | 103,7 | 906,4↑ | 524,1 | 529,2↑ | 222,4 | 328,7↑ | 639,6 | 705,3↑ |
| CCL26 | 1040,8 | 28524↑ | 215,9 | 577,6↑ | 46,7 | 782,2↑ | 90,3 | 107,2↑ |
| CCL27 | 8,5 | 47,3↑ | 28,5 | 25,9 | 18,36 | 15,3 | 24,1 | 22,3 |
| CXCL1* | 7,3 | 15,7↑ | 26,4 | 45,7↑ | 4,8 | 15,1↑ | 10,6 | 53,4↑ |
| CXCL2 | 386,6 | 10328↑ | 1162,7 | 4033,5↑ | 86,4 | 1040,9↑ | 578,1 | 236,2 |
| CXCL5 | 1394,3 | 15382↑ | 11782 | 9469,7 | 2026,6 | 2160,1↑ | 2702,7 | 2107,6 |
| CXCL6 | 16,3 | 502,9↑ | 5678,5 | 12311,8↑ | 1038,8 | 6279,6↑ | 42,5 | 46,8↑ |
| CXCL9 | 14,7 | 4773,6↑ | 12378 | 904,4 | 37,9 | 41,7↑ | 72,03 | 69,05 |
| CXCL10 | 22,2 | 16798↑ | 644,1 | 16164↑ | 28,2 | 27,9 | 3099,3 | 4888,4↑ |
| CXCL11 | 8,8 | 3320,2↑ | 403,3 | 65,1 | 3,07 | 4,09↑ | 141,8 | 235,8↑ |
| CXCL12 | 316,4 | 6454,8↑ | 517,1 | 4796,9↑ | 170,9 | 264,3↑ | 215,2 | 216,3↑ |
| CXCL13 | 0,48 | 5,65↑ | 40,6 | 2,38 | 1,21 | 1,13 | 3,36 | 3,79↑ |
| CXCL16 | 5,4 | 177,51↑ | 575,1 | 408,6 | 151,5 | 43,9 | 11,5 | 11,0 |
| CX3CL1 | 71,4 | 3002,4↑ | 126,6 | 361,9↑ | 40,6 | 184,8↑ | 3611,6 | 4952,4↑ |
| GM-CSF | 624,7 | 15277↑ | 30,1 | 37,1↑ | 37,9 | 24,5 | 68,4 | 68,8↑ |
| IFN-ϒ | 13,8 | 117,5↑ | 45,9 | 36,8 | 24,08 | 26,1↑ | 77,5 | 85,3↑ |
| IL-1β | 11,9 | 35,1↑ | 17,5 | 19,3↑ | 21,03 | 20,7 | 27,7 | 23,9 |
| IL-2 | 3,5 | 29,02↑ | 17,3 | 9,65 | 6,4 | 7,2↑ | 19,9 | 23,8↑ |
| IL-4 | 10,6 | 41,8↑ | 13,01 | 10,05 | 7,5 | 9,6↑ | 12,7 | 12,07 |
| IL-6* | 0,2 | 34,08↑ | 25,3 | 36,1↑ | 36,5 | 25,1 | 5,09 | 1,7 |
| IL-8 | 2668,2 | 10128↑ | 8787,7 | 9231,4↑ | 8886,9 | 9589,8↑ | 9699,5 | 7426,1 |
| IL-10 | 26,3 | 61,3↑ | 75,3 | 51,4 | 34,2 | 41,1↑ | 59,03 | 502,8↑ |
Tumor necrosis factor (TNF-α) expression in melanomas' tumoroids was increased in comparison with other groups of tumors. In particular, in culture #860 cells the production of this factor was increased from 4.88 pg/ml (monolayer) to 8.43 pg/ml (tumoroids); in culture #929 - from 4.51 pg/ml to 15.17 pg/ml; in culture #916 - from 15.82 pg/ml to 54.26 pg/ml; in culture #912 - from 5.46 pg/ml to 21.48 pg/ml; and culture #519 - from 0.51 pg/ml ml to 5.77 pg/ml.
No statistically significant increase in TGFβ1 in 3D culture compared to 2D was observed for all types of tumors: 2.123 (0.948–4.174) ng/ml in spheroids versus 2.478 (0.594–5.57) ng/ml in the monolayer, p = 0.46829. However, when analyzed individually, TGF-β1 production was doubled in 3D culture of LMS # 699 cells compared to 2D culture (1.53 ng/ml and 0.69 ng/ml, respectively). A similar trend was found in melanoma #912 cells - 3D / 2D 3.82 ng/ml and 2.47 ng/ml, respectively; in myxofibrosarcoma #728 cells - 3D / 2D 2.91 ng/ml and 3.73 ng/ml, respectively; in lung cancer #1014 cells - 3D / 2D 1.92 ng/ml and 2.37 ng/ml, respectively.
Discussion
Nowadays in preclinical trials, 3D in vitro models are becoming more in demand for the development of new drugs and therapeutic approaches in malignancy treatment 16, 21, 22.
One of the directions is the study of malignant neoplasms cells isolated from patients in three-dimensional biological systems in order to recreate the molecular complexity of carcinogenic mechanisms and search for ways to increase sensitivity to pharmacological treatment 23. According to some researchers, the generation of spheroids is especially important for the study of sarcomas, since the growth rate, cell morphology, and intercellular interactions in spheroids mimic primary tumors quite well 15.
In the current study, we performed a comparative analysis of the efficiency of spheroids formation from various histogenesis solid tumor cells, isolated from the patients, and changes in the properties of cultured malignant cells, depending on the spatial organization of the cell model in vitro. We studied the ability to form spheroids in 15 skin melanoma cultures, 20 STBS, 9 epithelial origin tumor cultures.
We obtained malignant cells cultures of various histogenesis with stable proliferative characteristics and passed at least 10 passages. All the obtained cultures were used to create spheroids; however, in a number of cases, stable spheroids were not formed. The overall efficiency of spheroid formation was 88.6% (39 out of 44), and did not depend on the histogenesis, but was probably associated with the stage of oncogenesis. Interestingly, the first works on the study of solid tumor spheroid formation have already indicated the genetic determination of malignant cells in the process of tumor progression. Thus, in J.M. Yuhas et al. (1978) study of breast cancer cell lines, spheroids formation was shown for cells isolated from primary and metastatic solid foci, in contrast to cells from pleural effusion and ascitic fluid 24. In our study, tumor cell cultures that did not form spheroids were of metastatic origin: 1 sample of skin melanoma, 2 - colorectal cancer, and 1 - pleomorphic liposarcoma (lung metastasis). One kidney cancer culture was derived from a primary tumor that had clinically extremely aggressive potential. Cultures that were characterized by the formation of loose unstable spheroids (5 skin melanoma, 1 kidney cancer, 1 lung cancer, 1 breast cancer) were also isolated from solid metastases, pleural fluid, and recurrence.
The spheroid formation process consists of at least three phases: initial aggregation of isolated cells, compaction of the spheroid, and its growth. Our observations coincide with other researchers' opinions 25–27. It was found that cells in spheroids, as in tumors, deposit extracellular matrix components: collagen IV, laminin, fibronectin, proteoglycans, tenascin, etc. 28. The close physical interaction between tumor cells and the extracellular matrix due to α5- and β1-integrins 29 and contacts between tumor cells due to E-cadherins 30 increase spheroid density, and create a certain barrier for the penetration and distribution of substances coming from outside 31, 32. In addition, intracellular components such as actin and microtubules also contribute to the formation of 3D structures 33, 34. We examined the obtained spheroids of breast cancer, STBS, and skin melanoma using confocal microscopy and found that their structural organization had similar features in different cell cultures. The central zone cells had a large number of outgrowths and protrusions containing F-actin, the peripheral zone cells were predominantly rounded and showed increased expression of F-actin, which may indicate a high potential for invasion
We did not detect E-cadherin expression in STBS and melanomas tumoroids. Normally, E-cadherin is expressed on the surface of epithelial cells, promoting the formation of the tight junction between cells 35. The presence of E-cadherin is also a characteristic of non-epithelial origin tumors. It is believed that malignant cells that have lost this protein exhibit the potential for invasion and metastasis. We observed explicit E-cadherin expression only in tumoroids formed from breast cancer cells. The distribution of E-cadherin molecules was uniform in tumoroids and in the tumor tissue itself. A study by A. Amann et al. (2014) of E-cadherin expression in lung cancer cell line A549 spheroids demonstrated that the loss of these cell adhesion receptors leads to a predominance of the mesenchymal phenotype and invasive activity of tumor cells 9 .
Many researchers believe that the kinetics of tumoroid growth in vitro is similar to the kinetics of solid tumors growth in vivo. The initial period of solid tumor growth is called the phase of avascular growth. During this period the tumor volume increases exponentially, then plateaus, followed by a phase of new vessels formation caused by angiogenic factors 36, 37. Under the action of matrix metalloproteinases (MMP-2, MMP-9), the extracellular matrix is remodeled, and tumor cells acquire the ability to invade and metastasize 38. In the process of tumoroids growth, their volume increases exponentially. Then, upon reaching a size of 200-500 μm in diameter, the growth rate decreases and reaches a plateau. Thus, spheroid's growth corresponds to the initial phase of tumor node growth 8. In our study, the largest stable spheroids (700-1000 μm in diameter) were obtained from skin melanoma cells, the smallest diameter (up to 400 μm) was possessed by spheroids from muscle tumor cells (rhabdo and leiomyosarcoma), other types of cells formed tumoroids with a diameter of 500-700 μm.
In the literature, one can find the opinion that, as solid tumors, spheroids are characterized by certain cellular zoning, the presence of which becomes more pronounced with an increase in the spheroid size. The outer layer is described with rapidly proliferating cells, the middle layer with senescent or dormant cells, and the inner layer containing necrotic cells 39. The size of spheroids can be from 100 to 1000 μm, and spheroids with a radius of 200 micrometers and more will have proliferating and resting zones, while spheroids much larger in radius may also contain a necrotic zone due to lack of nutrients and restriction of oxygen transport 40. In creating cell models, it seems important to characterize the proliferative properties of tumor cell cultures isolated from the patient's body. One of the most significant markers of proliferation is Ki67, presented in mitotically active cells throughout the entire mitotic cycle and absent in resting and differentiated cells 41 . In the literature, one can find the opinion that, as solid tumors, spheroids are characterized by certain cellular zoning, the presence of which becomes more pronounced with an increase in the spheroid size. The outer layer is described with rapidly proliferating cells, the middle layer with senescent or dormant cells, and the inner layer containing necrotic cells 39. The size of spheroids can be from 100 to 1000 μm, and spheroids with a radius of 200 micrometers and more will have proliferating and resting zones, while spheroids much larger in radius may also contain a necrotic zone due to lack of nutrients and restriction of oxygen transport 40. In creating cell models, it seems important to characterize the proliferative properties of tumor cell cultures isolated from the patient's body. One of the most significant markers of proliferation is Ki67, presented in mitotically active cells throughout the entire mitotic cycle and absent in resting and differentiated cells 41 .
The microenvironment in the inner part of the spheroid is acidified (pH range 6.5-7.2) due to the active pyruvate to lactate convert by tumor cells in hypoxia 42. This phenomenon is similar to the Warburg effect associated with lactate accumulation in solid tumors 32, 43. In response to the low pH, malignant cells in senescent and necrotic zones begin to actively produce factors for proliferation and survival 44, 45 .
We carried out a comparative study of the structure of spheroids consisting of different histotype origin malignant cells. We used proliferation marker Ki67 and the metabolic marker - glucose transporter protein GLUT1, which carries out unidirectional glucose transfer through the membrane under hypoxic conditions. In our 3D models, Ki-67 distribution was of two varieties: peripheral in the case when proliferating cells were concentrated in the marginal zone of the spheroid, and diffuse throughout the thickness of the tumoroid. In the study of human chondrosarcoma multicellular spheroids A. Voissiere et al. (2017) noted that on the 7th day of cultivation, Ki-67 distribution in the spheroids was uniform, while with the growth of the spheroid (14th and 20th days of cultivation) Ki-67 was mainly localized in the periphery 46. We did not find a clear dependence of Ki-67+ cells localization on the size and type of the spheroid.
M. Vinci et al. have demonstrated GLUT-1 uniform distribution in spheroids 47. In our study, we noted two types of GLUT-1 distribution in spheroids: uniform and gradient from the center to the periphery. At the same time, no clear dependence of GLUT-1 + cells localization on the size and type of spheroid was observed. In particular, the leiomyosarcoma spheroid had a diameter of 310.8 μm and diffuse distribution of Ki-67+ and GLUT-1 + populations; osteosarcoma spheroid was 752.7 μm in diameter with the marginal location of Ki-67+ and central location of GLUT-1 + . However, the rest of the spheroids were 550 - 690 μm in diameter and showed a different distribution of the studied markers, including a uniform one. We believe that this phenomenon needs more detailed study. Interestingly, Commander R. et al. (2020) demonstrated that during 3D spreading, cells that are heterogeneous in metabolic activity can be identified as "leader" cells if predominantly use mitochondrial respiration, and "subsequent" cells if rely on increased glucose uptake and, accordingly, actively produce GLUT1 maintaining an increased level of glucose uptake to maintain proliferation 48
Tumor cells are in constant interaction with the surrounding microenvironment, and in a sense, a tumor can be considered as a kind of multicomponent “ecosystem” where malignant cells optimize microenvironmental resources to create the best conditions for their proliferation 49, 50. Many soluble factors produced by tumor cells promote the emergence of complex local and regional immunosuppressive networks. Those favor tumor growth, invasion, and metastasis by inhibiting the activity of immune system cells directly involved in the recognition and elimination of malignant cells, reprogramming of myeloid cells such as neutrophils, monocytes, macrophages, forming a favorable and protective niche for a metastatic growth 51. In 2D and 3D tumor systems, we compared the production of several chemokines and cytokines that provide immunosuppression, invasion, and metastasis. We established that tumor cells in the 3D system presented more pronounced secretory activity about immunosuppressive factors and factors that ensure their mobility.
In 3D systems, CCR2 and CCR3 chemokines production was increased. As is known, CCL2–CCR2 signaling pathway is associated with the recruitment of macrophages and regulatory T-lymphocytes into the tumor 52, which may contribute to tumor progression. In addition, CCL2 shows protumorigenic action, which promotes cancer and metastasis development 53. Certain cultures of tumor cells in spheroids produced increased amounts of CXCL16 and CXCL12. The chemokine CXCL16 affects the migration of NKT and immature lymphoid cells 54. CXCL12 – CXCR4 signaling pathway is involved in the survival, proliferation, metastasis, and drug resistance of tumor cells 55 .
The interaction of MICA ligand on tumor cells with NKG2D activation receptor on NK cells and cytotoxic T-lymphocytes leads to their activation with subsequent elimination of tumor cells. However, in most tumors MICA ligand is overproduced causing the “sloughing off” of stress-induced MICA molecules from the surface of malignant cells. Thenafter the interaction of immune cells with such a soluble form of the molecule, leads to the loss of their effector functions 56. We have observed the activation of this mechanism in tumoroids.
We have observed an increase in Interleukin-10 production. It promotes the recruitment and activation of regulatory T-lymphocytes (Treg), the acquisition of a tolerogenic phenotype by dendritic cells, and suppression of the activity of CD8+ T-lymphocytes and NK cells 57. Being in 3D space, tumor cells enhanced the production of a macrophage migration inhibition factor (MIF), which is known as a tumor cell- and stromal cell-derived mediator of stromal cell recruitment, polarization, and differentiation 58 . TGF-β is a multipotent growth factor that affects differentiation, proliferation, apoptosis, and matrix production in normal and tumor cells. TGF-β acts as a tumor suppressor and promotor, triggering many processes that regulate tumor growth. As a tumor promotor, it induces tumor cells migration and stimulates the epithelial-mesenchymal transition 59. In a number of spheroids, an increase in TGF-β secretion was observed. The change in the secretory profile of malignant cells depending on the cultivation conditions demonstrates that to simulate the real spectrum of factors presented in the tumor microenvironment, it is necessary to reproduce the habitat of malignant cells, bringing it as close as possible to the natural one.
Conclusion
Cell models of human malignant neoplasms reflecting the structural and physiological complexity of tumor tissue are very important for preclinical studies in oncology. Our studies have demonstrated that in contradiction to monolayer cultures, the existence of a 3D environment of solid tumor cells of the patients leads to the activation of proliferative and metabolic processes, bringing these models closer to a real clinical situation. In a 3D cellular system, the synthetic activity of tumor cells is enhanced. On the one hand, that leads to the increased production of various chemokines capable of attracting various types of immune cells, including their immature forms. On the other hand, cytokines and immunosuppression factors begin to produce more active and being present in the tumor microenvironment in high concentrations, contribute to the formation of cells of the immune system with suppressive potential. Tumoroid cells show signs of increased proliferative activity, mobility, invasion potential, and epithelial-mesenchymal transition. Thus, it becomes clear that 3D spheroids creation from tumor cells of various histogenesis requires an individual approach and more in-depth study.
Authors’ Contributions
All authors participated in the design and writing of the manuscript.
Funding
This work was financially supported by the Russian Foundation for Basic Research (Project #18- 29-09014) to the Irina Baldueva
References
- 1.Ishiguro T. (2017) Tumor-derived spheroids: Relevance to cancer stem cells and clinical applications. , Cancer Science 108, 283-289.
- 2.Park E. (2019) Development of organoid-based drug metabolism model. , Toxicol. Appl. Pharmacol 385.
- 3.Nazari S S. (2020) Generation of 3D Tumor Spheroids with Encapsulating Basement Membranes for Invasion Studies. , Curr. Protoc. Cell Biol 87.
- 4.E A Taha. (2020) Knockout of MMP3 weakens solid tumor organoids and cancer extracellular vesicles. Cancers (Basel). 12.
- 5.Jensen C, Teng Y. (2020) Is It Time to Start Transitioning From 2D to 3D Cell Culture? Frontiers in. , Molecular Biosciences 7.
- 6.Baker B M, Chen C S. (2012) Deconstructing the third dimension-how 3D culture microenvironments alter cellular cues. , Journal of Cell Science 125, 3015-3024.
- 8.E C Costa, V M Gaspar, Coutinho P, I J Correia. (2014) Optimization of liquid overlay technique to formulate heterogenic 3D co-cultures models. , Biotechnol. Bioeng 111, 1672-1685.
- 9.Amann A. (2014) Development of an innovative 3D cell culture system to study tumour - Stroma interactions in non-small cell lung cancer cells. PLoS One 9.
- 10.Lazzari G. (2018) Multicellular spheroid based on a triple co-culture: A novel 3D model to mimic pancreatic tumor complexity. , Acta Biomater 78, 296-307.
- 11.Linxweiler J. (2019) three-dimensional spheroid cultures provide a versatile translational model for the study of organ-confined prostate cancer. , J. Cancer Res. Clin. Oncol 145, 551-559.
- 12.Froehlich K. (2016) Generation of Multicellular Breast Cancer Tumor Spheroids: Comparison of Different Protocols. , Journal of Mammary Gland Biology and Neoplasia 21, 89-98.
- 13.Jeppesen M. (2017) Short-term spheroid culture of primary colorectal cancer cells as an in vitro model for personalizing cancer medicine. , PLoS One 12.
- 14.Marconi A, Quadri M, Saltari A, Pincelli C. (2018) Progress in melanoma modelling in vitro. , Experimental Dermatology 27, 578-586.
- 15.Colella G. (2018) Sarcoma spheroids and organoids-Promising tools in the era of personalized medicine. , International Journal of Molecular Sciences 19, 615.
- 16.Gilazieva Z, Ponomarev A, Rutland C, Rizvanov A, Solovyeva V. (2020) Promising applications of tumor spheroids and organoids for personalized medicine. , Cancers 12, 1-19.
- 17.Capes-Davis A, R I Freshney. (2021) Freshney’s Culture of Animal Cells: A Manual of Basic Technique and Specialized Applications.
- 18.A O Danilov. (2004) An improved procedure for autologous gene-modified vaccine preparation for active specific immunotherapy of disseminated solid tumors. Вопросы онкологии 50. 219-227.
- 19.Geraldo S, Simon A, D M Vignjevic. (2013) Revealing the cytoskeletal organization of invasive cancer cells in 3D. , J. Vis. Exp
- 20.B S Everitt, Pickles A. (2004) Statistical Aspects of the Design and Analysis of Clinical Trials. Statistical Aspects of the Design and Analysis of Clinical Trials (PUBLISHED BY IMPERIAL COLLEGE PRESS AND DISTRIBUTED BY WORLD SCIENTIFIC PUBLISHING CO .
- 21.Feder-Mengus C, Ghosh S, Reschner A, Martin I, G C Spagnoli. (2008) New dimensions in tumor immunology: what does 3D culture reveal? Trends Mol. , Med 14, 333-340.
- 22.C J Lovitt, T B Shelper, V M Avery. (2014) Advanced cell culture techniques for cancer drug discovery. , Biology 3, 345-367.
- 23.Heredia-Soto V. (2019) 3D Culture Modelling: An Emerging Approach for Translational Cancer Research in Sarcomas. , Curr. Med. Chem 27, 4778-4788.
- 24.J M Yuhas, A E Tarleton, K B Molzen. (1978) Multicellular Tumor Spheroid Formation by Breast Cancer Cells Isolated from Different Sites. Cancer Res. 38, 2486-2491.
- 25.R M Enmon, K C O’Connor, D J Lacks, D K Schwartz, R S Dotson. (2001) Dynamics of spheroid self-assembly in liquid-overlay culture of DU 145 human prostate cancer cells. , Biotechnol. Bioeng 72, 579-591.
- 26.R Z Lin, L F Chou, Chien C C M, H Y Chang. (2006) Dynamic analysis of hepatoma spheroid formation: Roles of E-cadherin and β1-integrin. Cell Tissue Res. 324, 411-422.
- 27.L B Weiswald, Bellet D, Dangles-Marie V. (2015) Spherical Cancer Models in Tumor Biology. , Neoplasia (United States) 17, 1-15.
- 28.H F Chan. (2013) Rapid formation of multicellular spheroids in double-emulsion droplets with controllable microenvironment. , Sci. Rep 3.
- 29.C K Miranti, J S Brugge. (2002) Sensing the environment: A historical perspective on integrin signal transduction. , Nat. Cell Biol 4.
- 30.Smyrek I. (2019) E-cadherin, actin, microtubules and FAK dominate different spheroid formation phases and important elements of tissue integrity. , Biol. Open 8.
- 31.I F Tannock, C M Lee, J K Tunggal, Cowan D S M, M J Egorin. (2002) Limited penetration of anticancer drugs through tumor tissue: A potential cause of resistance of solid tumors to chemotherapy. , Clin. Cancer Res 8, 878-884.
- 32.Trédan O, C M Galmarini, Patel K, I F Tannock. (2007) Drug resistance and the solid tumor microenvironment. , Journal of the National Cancer Institute 99, 1441-1454.
- 33.E S Tzanakakis, L K Hansen, W S Hu. (2001) The role of actin filaments and microtubules in hepatocyte spheroid self-assembly. , Cell Motil. Cytoskeleton 48, 175-189.
- 34.Yoshii Y. (2011) The use of nanoimprinted scaffolds as 3D culture models to facilitate spontaneous tumor cell migration and well-regulated spheroid formation. , Biomaterials 32, 6052-6058.
- 35.Wong SHM, Fang C M, Chuah L H, Leong C O, Ngai S C. (2018) E-cadherin: Its dysregulation in carcinogenesis and clinical implications. Critical Reviews in Oncology/Hematology. 121, 11-22.
- 36.Ward J, King J. (1997) Mathematical modelling of avascular-tumour growth -. PubMed. Mathematical Medicine and Biology 14(1), 39-69.
- 37.Raica M, A M Cimpean, Ribatti D. (2009) Angiogenesis in pre-malignant conditions. , European Journal of Cancer 45, 1924-1934.
- 38.M Van Dijk, S A Göransson, Strömblad S. (2013) Cell to extracellular matrix interactions and their reciprocal nature in cancer. , Experimental Cell Research 319, 1663-1670.
- 39.Mehta G, A Y Hsiao, Ingram M, G D Luker, Takayama S. (2012) Opportunities and challenges for use of tumor spheroids as models to test drug delivery and efficacy. , J. Control. Release 164, 192-204.
- 40.D P Ivanov. (2014) Multiplexing spheroid volume, resazurin and acid phosphatase viability assays for high-throughput screening of tumour spheroids and stem cell neurospheres. PLoS One 9.
- 41.Juríková M, Danihel Ľ, Polák Š, Varga I. (2016) Ki67, PCNA, and MCM proteins: Markers of proliferation in the diagnosis of breast cancer. , Acta Histochemica 118, 544-552.
- 42.K O Alfarouk. (2014) Glycolysis, tumor metabolism, cancer growth and dissemination. A new pH-based etiopathogenic perspective and therapeutic approach to an old cancer question. , Oncoscience 1, 777-802.
- 43.J W Kim, C V Dang. (2006) Cancer’s molecular sweet tooth and the warburg effect. , Cancer Research 66, 8927-8930.
- 44.A L Harris. (2002) Hypoxia - A key regulatory factor in tumour growth. , Nature Reviews Cancer 2, 38-47.
- 45.S K Parks, Cormerais Y, Pouysségur J. (2017) Hypoxia and cellular metabolism in tumour pathophysiology. , Journal of Physiology 595, 2439-2450.
- 46.Voissiere A. (2017) Development and characterization of a human three-dimensional chondrosarcoma culture for in vitro drug testing. , PLoS One 12.
- 47.Vinci M. (2012) Advances in establishment and analysis of three-dimensional tumor spheroid-based functional assays for target validation and drug evaluation. , BMC Biol 10.
- 48.Commander R. (2020) Subpopulation targeting of pyruvate dehydrogenase and GLUT1 decouples metabolic heterogeneity during collective cancer cell invasion. , Nat. Commun 11.
- 50.Sleeboom J J F, H E Amirabadi, Nair P, C M Sahlgren, Toonder J M J Den. (2018) Metastasis in context: Modeling the tumor microenvironment with cancer-on-a-chip approaches. , DMM Dis. Model. Mech 11.
- 51.Russo V, M P Protti. (2017) Tumor-derived factors affecting immune cells. , Cytokine Growth Factor Rev 36, 79-87.
- 52.D F Quail, J A. (2013) Microenvironmental regulation of tumor progression and metastasis. , Nature Medicine 19, 1423-1437.
- 53.S Y Lim, A E Yuzhalin, A N Gordon-Weeks, R J Muschel. (2016) Targeting the CCL2- CCR2 signaling axis in cancer metastasis. , Oncotarget 7, 28697-28710.
- 54.Bachelerie F. (2014) International union of pharmacology. LXXXIX. Update on the extended family of chemokine receptors and introducing a new nomenclature for atypical chemokine receptors. Pharmacological Reviews. 66, 1-79.
- 55.S L Ham. (2018) Three-dimensional tumor model mimics stromal - breast cancer cells signaling. Oncotarget 9. 249-267.
- 56.Andrade L F De. (2020) Inhibition of MICA and MICB shedding elicits NK-cell-mediated immunity against tumors resistant to cytotoxic T cells. , Cancer Immunol. Res 8, 769-780.
Cited by (1)
- 1.Nekhaeva T. L., Danilova A. B., Fedoros E. I., Efremova N. A., Emelyanova N. V., et al, 2023, Development of in vitro laboratory models of the tumor immune microenvironment to evaluate quality parameters and specific efficacy of the dendritic cell vaccine, Siberian journal of oncology, 22(1), 82, 10.21294/1814-4861-2023-22-1-82-94