Morphological Features of Wild Mallard Ducks on Postnatal Growth Based on Functional Analysis of Capture-Recapture Data
- Open Access
- Peer Reviewed
- Similarity Checked
- CC BY 4.0
Abstract
Groups of wild juvenile and adult mallard ducks were captured, ringed, measured, while, juvenile ones already ringed, were remeasured on a subsequent recapture between March and September over a period of 7 years, at a site in Piedmont (Italy). Measurements cover both the rates and the pattern of development of 4 morphological features (head-and-bill-length, bill-length, tarsus-length, and weight). Juveniles were examined and their measurements were compared with the asymptotic value obtained from adults’ measures. A functional data analysis growth model was fitted to data and it yielded plausible quantitative estimates. Tarsus appears to reach the asymptote faster than the other morphological features in this population. Finally, a functional principal components analysis was performed to discriminate sex in growing Mallard ducks.
Article Information
- Received
- Accepted
- Published
Academic Editor: Lucilene Ines Jacoboski, Universidade Federal do Rio Grande do Sul | UFRGS · Departamento de Ecologia, Brazil.
Checked for plagiarism: Yes
Review by: Single-blind
Copyright © 2018 Mauro Giammarino, et al
 This is an open-access article distributed under the terms of the Creative Commons Attribution License, which permits unrestricted use, distribution, and reproduction in any medium, provided the original author and source are credited.
Corresponding author: Correspondence: Mauro Giammarino, Department of Prevention, ASL CN 1, Veterinary Service, Area Animal Sanity, Piazza Luigi Gallo 1, 12035 Racconigi (CN), Italy —
Competing Interests
The authors have declared that no competing interests exist.
Funding
No specific funding statement was provided by the authors.
Data Availability
No data-availability statement was provided by the authors.
Citation:
Introduction
Few growth pattern descriptions in Mallard ducks (Anas platyrhynchos) are available in the academic literature. Despite this, the intrinsic growth rate, defined as the relationship between size and age, is an important factor in life history theory 1, 2, since it plays an important role in the evolution of age trajectories for both fertility and mortality 3. In fact, it provides an optimal life history strategy for maximizing lifetime reproduction, which is determined by maximizing age survival and fecundity 4, 5. The size of most organisms (rather than the age) directly affects both survival probabilities 6, 7, 8 and individual fecundity 7, 9. Hence, we can hypothesize that organisms grow as fast as possible to achieve mature size 10, 11. Regarding to that, many strategies such as enlarging the initial size 12, 13 or expanding the period of growth and development 14 could be implemented to increase the size. Juvenile birds grow as quickly as possible in order to reduce the period of vulnerability to predators 15, but Ricklefs didn’t prove any correlation between growth rate and predation for temperate passerine birds 10, 16, 17. Food scarcity and/or poor quality food 18 as well as the ability of parents to nourish their offspring 15 are invoked as factors explaining slow growth in birds. Growth rates of different morphological features have been studied for many altricial species 19, 20, 21, 22, but few data are available for precocial species 23. The reasons why altricial species are preferred for these studies are due to the abundance of their nests and/or the ease to get repeated measurements throughout the nestling period. The problems related to repeated catching and measuring of precocial birds offspring explain why there is little literature about the quantification of precocial species growth. However, postnatal growth rate varies widely among species of birds 24. Growth rates are likely to be negatively related to the adult mass and they are higher for altricial birds than for precocial species 24, 25. The study of the avian growth curve and development is also important for comparisons within and among species 26, 27.
Nevertheless, the study of precocial species growth has raised another important issue: since the form of the avian growth curve varies considerably 28, several mathematical functions have been used to describe growth, such as the logistic, the Gompertz and the von Bartalanffy equation, but these functions are unfitting for precocial species such as Mallard ducks. Indeed for this species, there is a scarce availability of frequent known-age birds measurements as well as there is often a lack of growth data and fitting the above mentioned function using incomplete data can bias growth rate estimates 28, 29. Besides, the huge number of parameters involved makes some models unfeasible (the Richards model for example; 30).
The aim of this paper is to investigate development changes in the morphology of Mallard ducks during the hatching-independence stage. It is known that Mallard ducks Offspring are able to run and swim immediately after their hatching period and they can fly at an age of 50-60 days 31. Basing on these facts, we hypothesize that some mallard ducks physical features are particularly useful in order to escape from predators in the period immediately after their hatching. Regarding these features, we remark the bill for eating or the tarsus for swimming and running which should reach the mature size as quickly as possible, even though the adult weight is not achieved. For these purposes, we employed a novel statistical approach based on capture-recapture (C-R) data of young individuals and Functional Data Analysis (FDA, 32). The C-R method allowed us to collect different repeated measures from the same Mallard ducks individuals and hence this enabled us to build the mallard ducks growth curves 11. In particular, in the next pages we’ve reported growth rates, daily weight gain curves and daily weight gain curves relative to three morphological features: bill, bill+head, tarsus. Finally, we have used Functional Principal Components (FPC, 33) to discriminate males and females .
Methods
Study and Sampling Area
This study was conducted in the period of time 2007-2014, from March to September in a wetland located in the middle of the Royal Castle Park at Racconigi (province of Cuneo in the Piedmont Region, Northwestern Italy; 44°46’40’’N 7°40’28’’E). This area consists of several streams flowing into a 110.000 square meters wide lake. The mallard ducks were caught using three traps (with funnel-shaped openings and corn or wheat added for bait) placed along the stream banks and checked daily.
Morphometric Measurements
Traps authorized by the Institute for Environmental Protection and Research (ISPRA) can be used to capture only ducklings whose size is larger than that at birth, as the meshes of the nets allow a few days old individuals to escape. The smallest weight recorded is 220 g. For this reason and to avoid injuring the newly hatched by acting on nests, we did not ring newly born duckling in their nests. As consequence of that, we do not know their weight at birth. The body mass, tarsus length, bill length and the bill + head length (BH) were measured for all the birds following Baldwin et al.34 and Blakeslay et al. 35. The tarsus length was measured from the middle point of the joint, between the tibia and behind the metatarsus to the nearest 0.1 mm, using a pair of callipers with toes held at right angle to the tarsus 34. In a similar manner, the head-bill length was measured to the nearest 0.1 mm, from the back of the head to the tip of the bill. The bill length was measured to the nearest 0.1 mm, from the tip of the bill (culmen) to the most anterior point of the feathering on the forehead. Measurements of weight were made to the nearest 5 g 35.
By following Keller & van Noordwijk 36 we used the mean adult size to estimate the predicted size (asymptote) for each morphological feature of Mallard ducks. Both the adult and the juvenile ducks under study were from the same population and they were measured over the same time interval. The average weight of Mallard ducks at the first day of life is of 32.4 g 37. Because of the lack of measurements, we have no piece of information about the considered parameters in the Mallard ducks pre-fledging phase. As the values of the mentioned parameters are not available for newborns, we have used values obtained from the observations taken on a sample of 17 newly born Mallard ducks. These Mallard ducks belong to the same population and are born from abandoned eggs, which have been rescued and incubated until birth. The first day of post-hatching life was labelled as day 1. We aged the juveniles basing on their weight and the curve proposed by Giammarino & Quatto 11.
Ringing Procedure
We ringed Mallards with a metal ring tied on their right leg at first capture. Recaptured birds underwent the same measurement procedures used during the first capture. The sample consists of both adult and juvenile Mallard ducks, which were born in the same year of capture and recaptured, but at least twice in the period from May to September of the same year. Birds in their first year of life were recognized from aspect of plumage 31. Mallard ducks are born without feather and covered in a bicolored down. They show pale yellow-buff underparts, tinged cream-buff on chest and sides of body, as well as the forehead, the crown, the nape and lores. Furthermore, they show a streak, from eye through nape, a short dark sepia patch with slight olive tinge streak from hind cheek to hind neck and a smaller pale yellow patch on the rump.
Functional Data Analysis
FDA can be used to represent raw data which are recorded at discrete times as tik a suitable continuous function. This type of smooth curve is then fitted to the discrete observations so as to approximate a continuous underlying process 38. In order to obtain a good continuous-time function and reduce the noise in measurements 39, we used based-expansion methods, and applied B-spline expansions for modeling the growth of observed Mallard ducks.
B-splines can be used to approximate m discrete time series (indexed by i=1,…...m) by means of the basis expansions

where t belongs to the time-interval (a, b) and is the number of B-splines bj(t), which are obtained by minimizing the Penalized Sum-of-Squares Error (PSSE).
PSSE is the sum of two terms: the first represents the sum of squared approximation errors, which decreases as the B-spline approximation better fits the data; the second is linked to the strain energy (for details see Giammarino & Quatto 11).
Besides, we have considered functional principal components (FPC), which are orthonormal functions
useful to approximate m smoothed curves xi(t) through the expansions
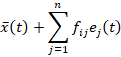
where

is the mean function, n is the number of orthonormal functions ej(t) and

are the FPC scores. The FPC ej(t) are selected so as to maximize the variance of the m values

 .
.
Interpretation of the FPC is aided by plotting the two curves

and by rotating the FPC by using the VARIMAX strategy (Ramsay & Silverman 2005).
We first considered all individuals that had been caught at least three times. For each of them, we built growth curves for tarsus, bill and BH. By fitting a FDA model, we obtained the average growth curves.
Finally, in order to represent functional data in a parsimonious way and discover the principal source of variation, we have performed the FPC analysis described above 33.
Results
A total of 21 immature individuals and 98 adult individuals were measured. Not all parameters were recorded for some birds in order to speed up the procedure and not to stress ducklings.
The asymptotes were 43,3 mm for tarsus, 53,1 mm for bill, 112,0 mm for BH and 1053,3 g for weight.
In Table 1, we show the basic statistics, like the mean, the standard deviation, the minimum, the maximum and the growth rate for the tarsus obtained (xi (t)) from FDA at given time points (age =t): 10 days: 30,6 (24,3 - 39,7), 20 days: 36,8 (29,1- 43,5), 30 days: 39,8 (33,9-44,0) and so on up to 100 days: 43,7 (43,7-43,7).
Table 1. Mean, standard deviation, minimum, maximum and growth rate of tarsus| Day | N | Tarsus Mean (min-max) | sd |
| 1 | 15 | 20,0 (20,0-20,0) | 0,0 |
| 10 | 15 | 30,6 (24,3-39,7) | 4,3 |
| 20 | 15 | 36,8 (29,1-43,5) | 4,1 |
| 30 | 14 | 39,8 (33,9-44,0) | 2,9 |
| 40 | 14 | 41,6 (38,5-44,3) | 1,8 |
| 50 | 13 | 42,5 (39,7-44.4) | 1,5 |
| 60 | 8 | 42,2 (39,9-43,6) | 1,4 |
| 70 | 3 | 43,0 (41,8-43,5) | 1,0 |
| 80 | 2 | 43,6 (43,6-43,6) | 0,04 |
| 90 | 2 | 43,6 (43,6-43,7) | 0,04 |
| 100 | 2 | 43,7 (43,7-43,7) | 0,04 |
In Table 2, the same statistics are shown for the bill: 1 day, 10 days: 24,7 (20,0 - 38,4), 20 days: 32,3 (25,6 - 45,0), 30 days: 37,8 (31,1 - 46,6) and so on up to 100 days: 53,8 (51.2 - 56.5).
Table 2. Mean, standard deviation, minimum, maximum and growth rate of bill| Day | N | Bill Mean (min-max) | sd |
| 1 | 19 | 15,0 (15,0-15,0) | 0,0 |
| 10 | 19 | 24,7 (20,0-38,4) | 4,7 |
| 20 | 19 | 32,3 (25,6-45,0) | 5,1 |
| 30 | 18 | 37,8 (31,1-46,6) | 4,5 |
| 40 | 18 | 41,9 (36.7-48.3) | 3,8 |
| 50 | 17 | 45,8 (38,9-52,9) | 3,6 |
| 60 | 13 | 48,8 (45,1-52,9) | 2,1 |
| 70 | 8 | 51,0 (46,7-54,3) | 2,4 |
| 80 | 3 | 52,9 (51,0-55,5) | 2,4 |
| 90 | 2 | 53,7 (51,1-56,2) | 3,6 |
| 100 | 2 | 53,8 (51,2-56,5) | 3,7 |
Table 3 shows these statistics for BH at the time points 26 day, 10 days: 53,0 (44,7 - 59,0), 20 days: 67,4 (52,0 - 76,5), 30 days: 79,6 (60,7 - 92,5) and so on up to 80 days: 109,4 (107,0 - 109,4).
Table 3. Mean, standard deviation, minimum, maximum and growth rate of BH| Day | N | BH Mean (min-max) | sd |
| 1 | 15 | 38,5 (38,0-38,5) | 0,1 |
| 10 | 15 | 53,0 (44,7-59,0) | 4,9 |
| 20 | 15 | 67,4 (52,0-76,5) | 8,1 |
| 30 | 14 | 79,6 (60,7-92,5) | 9,3 |
| 40 | 14 | 89,8 (71,8-106,3) | 8,7 |
| 50 | 12 | 96,7 (87,3-108,5) | 5,6 |
| 60 | 10 | 103,5 (99,4-108,1) | 2,7 |
| 70 | 6 | 105,5 (101,8-109,4) | 2,5 |
| 80 | 2 | 109,4 (107,0-109,4) | 3,4 |
Thanks to these data, we have been able to draw the average growth curve for each parameter. These are given in Figure 1, Figure 2, Figure 3. As far as tarsus is concerned, most of the curves is convex. The average curve reaches the asymptote at fledging age. However, from inspection of both the curves which show higher growth speed and the maximum values of the pertaining table, we can see that some individuals reach the asymptote at a precocious age (20 days). The asymptote is reached tardily for the bill (60-70 days as shown in Table 2). Also the related curves are less steep and some of them have a sigmoid trend. The asymptote for BH is not even reached at the age of 80 days (see Table 2), most of these curves are convex and only a few of them are of sigmoid type.
Figure 1. Growth curves and the mean curve (red) related to tarsus
Download figure
Figure 2. Growth curves and the mean curve (red) related to bill
Download figure
Figure 3. Growth curves and the mean curve (red) related to BH
Download figure
Figure 4 shows the growth mean curves of the three morphological features for comparison.
Figure 4. Average growth curves of tarsus, bill and BC.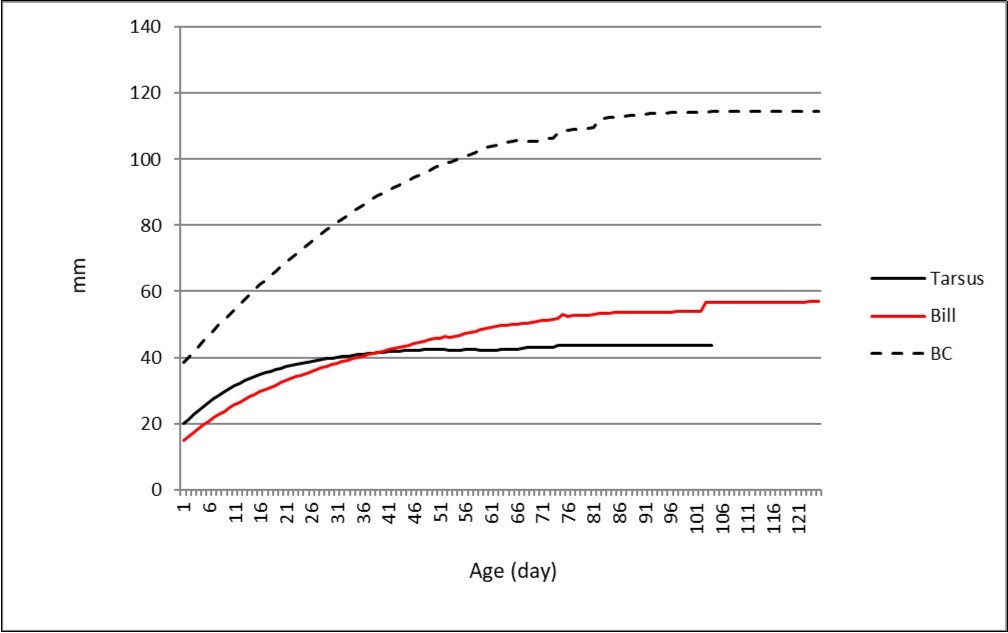
Download figure
Besides, for all parameters the daily growth extent has been computed.
Figure 5 provides a comparison of the daily gain curves of the three morphological features.
Figure 5. Daily gains of the tarsus, bill and BC.
Download figure
Finally, Figure 6, Figure 7, and Figure 8 show the results of FPC analysis for tarsus, bill and BH respectively. The first two principal components explain 97,6% of the variability for tarsus, 97,1% of the variability for bill, and 98,7 of the variability for BH.
Figure 6. Functional Principal Components related to tarsus
Download figure
Figure 7. Functional Principal Components related to bill
Download figure
Figure 8. Functional Principal Components related to BH
Download figure
Looking at Figure 5 we can see that the speed of tarsus growth tends to zero before the other two curves. The bill and also the BH continue to grow after fledging and reach adult values at about 80 days for bill (Table 2) and over 80 for BH (Table 3). The tarsus at fledging (50-60 days of life according to Cramp 31) is 98,1% of asymptote (at 50-60 days old), bill at fledging: 86,2% (at 50 days) and 91,8% (at 60 days), BH: 86,3% (at 50 days); 92,4% (at 60 days).
Discussion and Conclusion
Most of the vertebrate growth curves described in literature are of determinate type. This kind of model is characterized by a reachable maximum size which animals during their growth progressively tend to attain by reducing their growth speed. For this reason this model is also called asymptotic 30. Such a model is valid for bacteria, all birds 24, 40, fish 41, bugs and most of mammals 42, 43. The way the animals approach the asymptote during their growth can be described by different curves, like the exponential, the logistic and the sigmoid curve.
The results provided in this paper supplement and complete those concerning the average growth curve of weight of mallard ducks provided by Giammarino & Quatto 11. Starting from the mentioned work, where it is proved that the weight represents a valid indicators of the age of mallard ducks, in this paper we have used functional data analysis (FDA) to determine the age of these birds at the moment of their capture/recapture so as to build growth curves for other parameters.
In our analysis the trend of the average curves for the three parameters under study is the convex type (see Figure 4). The curve relative to tarsus reaches the asymptote both faster and precociously (in some Mallard ducks already apparent at day 20 of life: see Table 1). In fact the individual growth curves relative to tarsus are steeper than the others (Figure 1).
Rapid tarsus development is not unique to mallards and may be related to an efficient early locomotion in a variety of avian taxa 44. This effect has been observed also in (Strixoccidentalis) 20, Bald eagles (Haliaeetus leucocephalus; 45), Burrowing owls (Athene cunicularia; 46), and in waders 23.
Muscle tissue is supposed to develop before skeletal tissue and it is assumed to be the factor that influence the skeleton rate development 25. In precocial species the leg muscle is functionally more important. In Laruscalifornicus, semiprecocial species, the paw skeleton is more developed than wing skeleton at the hatching 39. In Dotterel (Charadriusmorinellus), precocial species, the chicks hatch with tarsus, bill and BH well developed, but a poor wing development 23.
It can be assumed that the whole skeleton, along with the tarsus, reaches final size after fledging, with rates of growth which vary for different skeleton sectors depending on the type of juvenile locomotion 30. Indeed, it is difficult to think that, being the pelvic belt already developed, the muscles involved in flight work by clinging to bone segments not mature yet. Mallard ducks’ tarsus may grow faster than other parameters because these birds need to move as fast as possible both on the ground, to escape from predators, and in the water to search for more effectively food at that time of the life when their wings are not functional.
In mallard ducks the weight increase after fledging and this could be due mainly to the muscular component induced by flight itself. However it seems that weight starts increasing later than in other birds, probably for the same growth of those muscles engaged in flight.
In our analysis, the bill growth seems protracted. Many species exhibit this type of strategy 47, 48, while others present a higher growth speed 23. No hypotheses have been done forward to explain this difference.
The FPC analysis performed on tarsus, bill and BH leads to divide the group under analysis into two sub-groups: one of which seems to grow more rapidly than the other.
In fact, one part of the wild ducks is over the average of the group (which is zero), another is below. It is reasonable to suppose that the two distinguished groups are respectively males and females.
We have obtained encouraging results for 11 out of the 12 mallard ducks on which the all three FPC were carried out. In fact the result is encouraging since 9 have results shared by two FPC (while the third provides uncertain results), for 2 Mallard ducks on all the FPC. Only one duck shows as uncertain (CH 9967).
Further research using C-R and FPC should be carried out to confirm the data. The FPC analysis does seem like a good approach for determining sex of growing Mallard ducks.
Functional analysis of capture-recapture data has been shown to be an effective approach for representing the growth curves and the daily values, even if observations are relatively few and the dates of birth are not known with precision. This approach could be usefully employed for studying the growth of other animals (in addition to avian species), when standard methods are not applicable, for example in the case of precocial species or species which are hard to recapture before they reach the adult size.
References
- 1.Gotthard K, Nylin S, Wiklund C. (1994) Adaptive variation in growth rate: life history costs and consequences in the speckled wood butterfly,Parargeaegeria. , Oecologia 99, 281-289.
- 2.J D Arendt. (1997) Adaptive intrinsic growth rates: an integration across taxa. , Quarterly Review of Biology 72(2), 149-177.
- 3.G C Williams. (1957) Pleiotropy natural selection evolution of senescence. , Evolution 11, 398-411.
- 4.D A Roff. (1992) The evolution of life histories: theory and analysis. Chapman and Hall. , New York
- 6.K L Gross. (1981) Predictions of fate from rosette size in four “biennal” plant species:VerbascumThapsus. , Oenotherabiennis, Daucuscarota, andTrapogondubius. Oecologia 48, 209-213.
- 7.J B McGraw, R D Wulff. (1983) The study of plant growth: a link between the physiological ecology and population biology of plants. , Journal of Theoretical Biology.103 21-28.
- 8.Werner E E. (1988) Size, scaling, and evolution of complex life cycles. , InBEbenman,LPersson,editors. Size-Structured Population.Berlin:Springer-Verlag 60-81.
- 9.L W Aarssen, M J Clauss. (1992) Genotypic variation in fecundity allocation in Arabidopsis thaliana. , Journal of Ecology 80, 109-114.
- 10.Ricklefs R E. (1969) Preliminary models for growth rates of altricial birds. , Ecology 50, 1031-1039.
- 11.Giammarino M, Quatto P. (2017) Growth curves of wild Mallard, based on functional analysis of capture–recapture data. Doi: 10.1080/03078698.2017.1332299. Ringing and Migration.
- 12.Reznick D. (1982) Genetic determination of off-spring size in the gruppy (Poeciliareticulate). , The American Naturalist 120, 181-188.
- 13.J M Elliott. (1989) Growth and size variation in contrasting population of troutSalmotrutta: an experimental study on the role of natural selection. , Journal of Animal Ecology 58, 45-58.
- 14.Neat F, Fowler K, French K, Partridge L. (1995) Thermal evolution of growth efficiency in drosophila melanogaster. , Proceedings of the Royal Society of London B 260, 73-78.
- 15.T J Case. (1978) On the evolution and adaptive significance of postnatal growth rates in the terrestrial vertebrates. , Quarterly Review of Biology 53, 243-282.
- 16.Remeš V, T E Martin. (2002) Environmental influence on the evolution of growth and developmental rates in passerines. , Evolution 56, 2505-2518.
- 17.D A Roff, Remeš V, T E Martin. (2005) The evolution of fledging age in songbirds. , Journal of Evolutionary Biology 18, 1425-1433.
- 18.T E Martin. (1987) Food as a limit on breeding birds: a life-history perspective. , Annual Review of Ecology and Systematics 18(1), 453-487.
- 19.Ricklefs R E. (1997) Comparative demography of new world population of Thrushes (Turdusspp.). , Ecological Monographs 67, 23-43.
- 20.D M Kristan, R J Gutiérrez, A B Franklin. (1996) Adaptive significance of growth patterns in juvenile spotted owls. , Canadian Journal of Zoology.74 1882-1886.
- 21.Negro J J, Chastin A, D M Bird. (1994) Effects of short-term food deprivation on growth of hand-reared American kestrels. , Condor 96, 749-760.
- 22.N S Sodhi. (1992) Growth of nestling merlins,Falcocolumbarius. The Canadian Field-Naturalist.106. 387-389.
- 23.D L Thomson. (1994) . Growth and development in Dotterel chicksCharadriusmorinellus.Bird Study 41, 61-67.
- 24.J M Starck, Ricklefs R E. (1998) Avian growth and development: Evolution within the altricial-precocial spectrum. Oxford Ornithology Series,OxfordUniversityPress,UK.
- 25.Ricklefs R E.(1979b).Adaptation, constraint, and compromise in avian postnatal development. , Biological Reviews 54, 269-290.
- 26.Ricklefs R E.(1979a).Patterns of growth in birds. V. A comparative study of the growth and development in the starling, common tern, and Japanese quail. , Auk 96, 10-30.
- 28.S H Austin, T R Robinson, W D Robinson.Ricklefs R.E.(2011). Potential biases in estimating the rate parameter of sigmoid growth functions. Methods in Ecology and Evolution 2, 43-51.
- 29.Ricklefs R E. (1983) Avian postnatal development. Avian Biology(eds:Farner DS, King JR and Parkes KC) .Academic , Press,New York 1-82.
- 30.A S Karkach. (2006) Trajectories and models of individual growth. , Demographic Research 15(12), 347-400.
- 31.Cramp S, Simmons K E L. (1977) . Handbook of the bird of Europe the Middle Est and North Africa, the Birds of the Western Palearctic. Ostrich to Ducks , Oxford 1.
- 33.F Di Salvo, Ruggieri M, Plaia A. (2015) Functional Principal Component Analysis for multivariate multidimensional environmental data. Environmental and Ecological Statistics. 22(4), 739-757.
- 34.S P Baldwin, H C Oberholser, L G Workey. (1931) Measurements of birds. Scientific Publication of the Cleveland Museum of Natural History II .
- 35.J A Blakeslay, A B Franklin, R J Gutierrez. (1990) Sexual dimorphism in northern spotted owls from northwest California. , Journal of Field Ornithology 61, 320-327.
- 36.L F Keller, Noorddwijk A J van. (1993) A method to isolate environmental effects on nestling growth, illustrated with examples from the great tit (Parusmajor). Functional Ecology.7. 493-502.
- 37.J T Lokemoen, D H Johnson, D E Sharp. (1990) Weights of wild MallardAnas platyrhynchos, GadwallAnasstrepera, and Blue-winged TealAnasdiscorsduring the breeding season. , Wildfowl 41, 122-130.
- 38.Hall P, H G Müller, J L Wang. (2006) Properties of principal component methods for functional and longitudinal data analysis. , The Annals of Statistics 34, 1493-1517.
- 39.Carrier D, Leon L R. (1990) Skeletal growth and function in the California gull (Laruscalifornicus). , Journal of Zoology 222, 375-389.
- 42.Kuczmarski R, Ogden C, Guo S. (2000) CDC growth charts for the United States: methods and development. Series report. National Center for Health Statistics, vital healt stat 11 (246) edition.
- 43.J F Tanner, S J Ulijaszek, F E Johnston, M A Preece. (1998) The Cambridge Encyclopedia of human growth and development.CambridgeUniversityPress,1stedition.
- 44.G T Austin, Ricklefs R E. (1977) Growth and development of the rufous-winged sparrow (Aimophilacarpalis). , Condor 79, 37-50.
- 45.G R Bortolotti. (1994) Physical development of nestling bald eagles with emphasis on the timing of growtn events. , Wilson Bulletin 96, 524-542.
- 46.Landry R E. (1979) Growth and development of the burrowing owl,Athenecunicularia. , M. A. thesis,CaliforniaStateUniversity,Long Beach