The Sweet and Sour of the Sugar-Sweetened Beverage Tax
Abstract
Obesity is a common and preventable Non-Communicable Disease that is of great importance. Population-based interventions are recognised to have a profound effect on improving health outcomes. One of these approaches includes the adoption of the Sugar-Sweetened Beverage (SSB) Tax.
Objectives
There were three objectives, 1) explore the associations between gender, age, nationality, and change in SSB consumption, 2) explore SSB consumption during Covid-19 lockdown, and 3) inform policy decision making.
Methods
A cross-sectional survey in the United Arab Emirates. We performed descriptive analysis and chi-square for independence to test the difference between the expected and the observed frequencies in one or more categories.
Results
Since the introduction of SSB tax, change in SSB consumption by gender, age or nationality was not statistically significant. Further analysis of the proportion of sugar intake per day was statistically significant (P-value <0.001) by nationality. There was no statistically significant change in SSB consumption by age, gender, or nationality during the Covid-19 lockdown. Further analysis within the group that reported change in SSB consumption suggests a majority (80.5%) reported a reduction in SSB consumption.
Conclusions
Change in SSB consumption by gender, age or nationality was not statistically significant since the introduction of SSB tax, or during Covid-19 lock-down; thus, we accept the Null Hypothesis. Imposing a levy on frequently consumed SSB or revisiting levy by the gram, volume, or type of added sugar (or in combination) may prove to be more effective in reducing SSB consumption. Further research is needed to determine the extent other demographic factors influence SSB consumption as well as the enablers and barriers associated with SSB consumption.
Author Contributions
Academic Editor: Sasho Stoleski, Institute for Occupational Health, Skopje, Republic of Macedonia. WHO Collaborating Centre, Ga2len Collaborating Centre, Skopje, Republic of Macedonia.
Checked for plagiarism: Yes
Review by: Single-blind
Copyright © 2021 Al-Alawy Khamis, et al.
 This is an open-access article distributed under the terms of the Creative Commons Attribution License, which permits unrestricted use, distribution, and reproduction in any medium, provided the original author and source are credited.
Competing interests
The authors have declared that no competing interests exist.
Citation:
Introduction
Obesity is a common and preventable Non-Communicable Disease (NCD) of great clinical importance and public health concern. 1, 2 Obesity raises the risk of developing diseases such as coronary heart disease, diabetes, cancer, self-esteem, and emotional well-being. 3, 4, 5 Obesity also affects the health system and contributes to low productivity and economic loss. 6, 7 In 2019, The United Arab Emirates Ministry of Health and Prevention (MOHAP) reported marked improvements in adult obesity prevalence (37.2% in 2010 to 27.8% in 2019); however, the burden of associated disease and its impact on healthcare services, healthy life expectancy, and economic productivity remains an ongoing concern. 8, 9, 10 To address the health and societal costs associated with obesity, several countries have adopted a Sugar-Sweetened Beverage (SSB) tax; however, policy development and implementation approaches vary, creating complexity in adopting best practice contextually.11 In 2017, the UAE announced an excise sugar tax to reduce unhealthy consumption and harmful commodities to the environment and was fully implemented in 2019.12 The 'Logical Pathway' framework provides insight on the process and expected outcomes from SSB taxation. However, the pathway remains challenging to implement due to the unpredictability of the price pass on rates, price elasticity across different SSB products, substitution effect and lack of evidence on its effectiveness to reduce obesity prevalence (figure 1). 13, 14 The rationale for taxation stems from the evidence that food and drink contribute to child and adult obesity and are price elastic products; thus, taxation can impact unhealthy consumption levels.15, 16 Taxation (pigouvian tax) is also seen as favourable and necessary to correct the adverse health effects of unhealthy consumption and is a revenue source for developing and implementing healthier alternatives. 17 Studies have reported associations between different demographic factors and SSB consumption, but little is known about SSB behaviors in the United Arab Emirates (UAE). 18, 19, 20, 21 SSB consumption by age and gender are key factors for research because consumption and calorific needs vary by age and gender. 22 On average, men require 600-800 more calories than women at the age of 18 years, at all activity levels (sedentary, moderately active, and active), and the difference between calorific intake by gender narrows as age increases. 23 Our Null Hypothesis (H0) was a) Gender, Age and Nationality does not affect SSB consumption since the introduction of SSB tax and, b) Gender, Age or Nationality does not affect SSB consumption during Covid-19 lockdown. Our objectives were to 1) explore the associations between age, gender, nationality and change in SSB consumption, 2) explore SSB consumption during Covid-19 lockdown, and 3) inform policy decision making.
Figure 1.The Logical Pathway for Implementing the Sugar-Sweetened Beverage Tax - Modified from the Institute of Economic Affairs. 13
Methods
Development and Distribution of Survey
A cross-sectional, nationally representative survey was developed following a review of the evidence and research group discussions. 24, 25, 26, 27, 28, 29, 30 Following a pilot phase, the survey was revised and coded using Cronbach Alpha Analysis. The survey included UAE SSB definition (any product with added sugar or other sweeteners, whether in the form of a beverage or a concentrate, powder, gel, extract), or any product that may be converted into a beverage, e.g. energy drinks or carbonated drinks and examples of sugar (white sugar, sucrose, dextrose, fructose, glucose syrup, and lactose, among others). 12 The survey was themed by demographics (age, gender, nationality, residency location) and SSB consumption. Consumption was split into two parts. Part one focused on consumption since the introduction of SSB tax using a five Likert scale (I consume a lot less to I consume a lot more) and percentage of sugar consumed per day from SSB (0%, 20%, 40%, 60%, 80%, 100% and I don't know). Part two included questions on change of SSB consumption during Covid-19 lockdown (yes, no) implemented in 2020. Responses with a yes were then asked to respond to a five Likert scale (I consume a lot less to I consume a lot more). Ethical approval was granted by the Mohammed Bin Rashid School of Government (MBRSG) Ethics Committee (REC-80-2020). The survey was issued electronically in English and Arabic through the Mohammed Bin Rashid School of Government (MBRSG) electronic survey system (Qualtrics). We adopted a random sampling approach and distributed the survey through different government institutions, professionals, and social media channels across the UAE for eight weeks (01/08/20 to 30/09/20). Participants were asked to consent at the start of the survey and were also offered the opportunity to withdraw at any time. Based on the statistical sample size table and reference to a sample size calculator with a 5% margin of error, confidence level as 95% and study population size (adults) as 6 600 000 and the response distribution of 50%, the minimum sample size needed for the study was 385 adults across the UAE. 31, 32, 33, 34
Data Collection and Analysis
Data were collected in two languages (Arabic and English) through the Qualtrics survey system. Responses in Arabic were translated into English through the Qualtrics system and checked by a native Arabic speaker. All survey data was downloaded onto Microsoft Excel. Data were cleaned and coded on Microsoft Excel as per the survey questions, and responses were transferred into Statistical Package for Social Sciences (SPSS) Subscription version 2021 for analysis.
Analysis of responses was done for age, gender, and nationality. Age was analysed by the seven categories from the survey (18-25, 26-30, 31-35, 36-40,41-45,46-59 and 60 plus), gender as male and female, and nationality by Emirati and non-Emirati.35, 36 Cross table analysis were performed for each demographic variable against SSB consumption following the introduction of SSB tax, percentage of sugar consumed from SSB per day and SSB consumption during Covid-19 lockdown. Data was presented by demographic variable, number of cases, number of valid cases and percentages and by the number of responses for each category on the Likert scale. Statistical tests to determine the association between the demographic variable and consumption includedPearsons Chi-Square, Likelihood Ratio and Linear-by-linear Association. For the group that reported a change in consumption during Covid-19 lockdown, we provided a breakdown of the responses in a bar chart.
Results
Demographic Characteristics of Survey Respondents
7,500 participants were recruited into the study, and we received 1 290 surveys (participation rate = 17.2%). The distribution of gender was 472 (36.7%) male and 817 (63.3%) female. For Nationality, we report 548 (42.5% Emirati) and 742 (57.5%) Non-Emirati. For age group, we report 276 respondents aged 31-35 years, 274 aged 46-59years, 270 respondents aged 41-45 years, 254 respondents aged 36-40 years, 157 respondents aged 26-30 years, 31 respondents aged 8-25 years, and 26 respondents aged over 60 years. Two missing responses were noted for age, 179 for change in SSB since tax, 179 for the percentage of sugar intake, and 179 for change in SSB consumption since Covid-19 lockdown. Overall, the demographic profile for gender, age, and nationality was consistent with national population data distribution.
Change in SSB Consumption Since the Introduction of SSB Tax
Change in SSB consumption since the introduction of SSB tax by gender, age, and nationality is presented in table 1. We report the highest proportion of responses in the 'no change in consumption’ category for all three demographic variables (522, 521 and 522, respectively). They were 336 respondents that reported consuming a lot less and 218 that reported slightly less. The fewest responses were in the consume more categories (consume slightly more N = 27 and consume a lot more N = 8). There was no statistical significance observed for change in SSB consumption for gender, age, or nationality.
Table 1. SSB Consumption Since Introduction of SSB Tax by Gender, Age and Nationality.
| Demographic Variable | Number of Cases | Number of Valid Cases | I consume a lot less | I consume slightly less | No Change in Consumption | I consume slightly more | I consume a lot more |
| Male | 1290 (100%) | 413 | 143 | 80 | 181 | 8 | 1 |
| Female | 698 | 193 | 138 | 341 | 19 | 7 | |
| Total | 1111 (86.1%) | 336 | 218 | 522 | 27 | 8 | |
| Chi-Square Tests | Value | df | Asymptotic significance (2-sided) | ||||
| Pearsons Chi Square | 8.334a | 4 | 0.080 | ||||
| Likelihood Ratio | 8.670 | 4 | 0.070 | ||||
| Linear-by-linear Association | 7.423 | 1 | 0.006 | ||||
| No. of Valid Cases | 1111 | ||||||
| a. 1 cell (10%) have expected count less than 5. The minimum expected count is 2.97. | |||||||
| Demographic Variable | Number of Cases | Number of Valid Cases | I consume a lot less | I consume slightly less | No Change in Consumption | I consume slightly more | I consume a lot more |
| Age (18-25) | 1290 (100%) | 27 | 4 | 3 | 18 | 2 | 0 |
| Age (26-30) | 129 | 33 | 29 | 64 | 3 | 0 | |
| Age (31-35) | 244 | 72 | 45 | 121 | 5 | 1 | |
| Age (36-40) | 214 | 66 | 46 | 94 | 7 | 1 | |
| Age (41-45) | 235 | 63 | 46 | 115 | 8 | 3 | |
| Age (46-59) | 236 | 90 | 42 | 99 | 2 | 3 | |
| Over 60 | 24 | 8 | 6 | 10 | 0 | 0 | |
| Total | 1109 (86%) | 336 | 217 | 521 | 27 | 8 | |
| Chi-Square Tests | Value | df | Asymptotic significance (2-sided) | ||||
| Pearsons Chi Square | 27.869a | 24 | 0.266 | ||||
| Likelihood Ratio | 29.313 | 24 | 0.209 | ||||
| Linear-by-linear Association | 5.766 | 1 | 0.016 | ||||
| No. of Valid Cases | 1109 | ||||||
| a. 11 cells (31.4%) have expected count less than 5. The minimum expected count is 0.17. | |||||||
| Demographic Variable | Number of Cases | Number of Valid Cases | I consume a lot less | I consume slightly less | No Change in Consumption | I consume slightly more | I consume a lot more |
| Emirati | 1290 (100%) | 458 | 139 | 82 | 221 | 13 | 3 |
| Non-Emirati | 653 | 197 | 136 | 301 | 14 | 5 | |
| Total | 1111 (86.1%) | 336 | 218 | 522 | 27 | 8 | |
| Chi-Square Tests | Value | df | Asymptotic significance (2-sided) | ||||
| Pearsons Chi Square | 2.022a | 4 | 0.732 | ||||
| Likelihood Ratio | 2.026 | 4 | 0.731 | ||||
| Linear-by-linear Association | .282 | 1 | 0.595 | ||||
| No. of Valid Cases | 1111 | ||||||
| 2 cells (20.0%) have expected count less than 5. The minimum expected count is 3.30. | |||||||
Percentage of Daily Sugar Intake from SSB
The percentage of daily sugar intake from SSB is presented in table 2. For gender, age and nationality, the highest responses were reported in the 20% category (N = 318) followed by 0% (N = 181), I don’t know (N = 175), 40% (N =169), 60% (N = 135) and 80% (N = 116). The lowest responses were in the 100% category (N = 17). Female responses for each percentage were higher. Responses for 18-40 years were higher (N = 619) than those above 40-years (490). For nationality, 457 responses were Emirati and 654 we non-Emiratis. Statistical significance was only observed by Nationality (P-value <0.001).
Table 2. Percentage of Sugar Consumed/day from SSB by Gender, Age and Nationality.
| Demographic Variable | Number of Cases | Number of Valid Cases | 0% | 20% | 40% | 60% | 80% | 100% | I don’t know |
| Male | 1290 (100%) | 411 | 74 | 124 | 56 | 40 | 40 | 8 | 69 |
| Female | 700 | 107 | 194 | 113 | 95 | 76 | 9 | 106 | |
| Total | 1111 (86.1%) | 181 | 318 | 169 | 135 | 116 | 17 | 175 | |
| Chi-Square Tests | Value | df | Asymptotic significance (2-sided) | ||||||
| Pearsons Chi Square | 7.439a | 6 | 0.282 | ||||||
| Likelihood Ratio | 7.518 | 6 | 0.276 | ||||||
| Linear-by-linear Association | 0.191 | 1 | 0.662 | ||||||
| No. of Valid Cases | 1111 | ||||||||
| a. 0 cells (.0%) have expected count less than 5. The minimum expected count is 6.29. | |||||||||
| Demographic Variable | Number of Cases | Number of Valid Cases | 0% | 20% | 40% | 60% | 80% | 100% | I don’t know |
|---|---|---|---|---|---|---|---|---|---|
| Age (18-25) | 1290 (100%) | 27 | 3 | 13 | 2 | 2 | 4 | 0 | 3 |
| Age (26-30) | 129 | 14 | 38 | 29 | 15 | 16 | 0 | 17 | |
| Age (31-35) | 243 | 38 | 63 | 42 | 37 | 26 | 6 | 31 | |
| Age (36-40) | 220 | 37 | 59 | 33 | 29 | 23 | 3 | 36 | |
| Age (41-45) | 237 | 38 | 66 | 31 | 28 | 28 | 5 | 41 | |
| Age (46-59) | 230 | 44 | 71 | 29 | 23 | 19 | 2 | 42 | |
| Over 60 | 23 | 7 | 8 | 2 | 1 | 0 | 1 | 4 | |
| Total | 1109 (86%) | 181 | 318 | 168 | 135 | 116 | 17 | 174 | |
| Chi-Square Tests | Value | df | Asymptotic significance (2-sided) | ||||||
| Pearsons Chi Square | 40.124a | 36 | 0.292 | ||||||
| Likelihood Ratio | 43.797 | 36 | 0.174 | ||||||
| Linear-by-linear Association | 0.002 | 1 | 0.967 | ||||||
| No. of Valid Cases | 1109 | ||||||||
| a. 17 cells (34.7%) have expected count less than 5. The minimum expected count is .35. | |||||||||
| Demographic Variable | Number of Cases | Number of Valid Cases | 0% | 20% | 40% | 60% | 80% | 100% | I don’t know |
| Emirati | 1290 (100%) | 457 | 59 | 115 | 67 | 60 | 62 | 9 | 85 |
| Non-Emirati | 654 | 122 | 203 | 102 | 75 | 54 | 8 | 90 | |
| Total | 1111 (86.1%) | 181 | 318 | 169 | 135 | 116 | 17 | 175 | |
| Chi-Square Tests | Value | df | Asymptotic significance (2-sided) | ||||||
| Pearsons Chi Square | 21.700a | 6 | 0.001 | ||||||
| Likelihood Ratio | 21.675 | 6 | 0.001 | ||||||
| Linear-by-linear Association | 17.729 | 1 | <0.001 | ||||||
| No. of Valid Cases | 1111 | ||||||||
| a. 0 cells (.0%) have expected count less than 5. The minimum expected count is 6.99. | |||||||||
Change in SSB Consumption During the Covid-19 Lockdown
Table 3. presents the findings by gender, age, and nationality. Responses for change in SSB Consumption during Covid-19 Lockdown was grouped into ‘yes’ and ‘no’. 574 reported a change in SSB consumption (exception 572 for age variable), and 537 reported no change in SSB consumption during the Covid-19 lockdown. There was no statistical significance observed for change in SSB consumption during Covid-19 lockdown. Of the 574 who reported having had a change in SSB consumption during Covid-19 lockdown, 308 (53.7%) reported to consume a lot less, 154 (26.8%) reported to consume slightly less, 24 (4.2%) reported no change, 74 (12.9%) reported to consume slightly more, and 13 (2.3%) reported to consume a lot more. In summary, 462 (80.5%) had reported a reduction in their SSB consumption, and 87 (15.2%) reported consuming more (figure 2).
Table 3. Has Your Consumption Changed During the Corona Virus Disease (COVID-19) Lockdown?
| Demographic Variable | Number of Cases | Number of Valid Cases | Yes | No | |
| Male | 1290 (100%) | 413 | 210 | 203 | |
| Female | 698 | 364 | 334 | ||
| Total | 1111 (86.1%) | 574 | 537 | ||
| Chi-Square Tests | Value | df | Asymptotic significance (2-sided) | Exact Sig. (2-sided) | Exact Sig. (1-sided) |
| Pearsons Chi Square | .176a | 1 | .675 | ||
| Likelihood Ratio | .128 | 1 | .721 | ||
| Fishers Exact Test | .176 | 1 | .675 | ||
| Linear-by-linear Association | .709 | .360 | |||
| No. of Valid Cases | .176 | 1 | .675 | ||
| a. 0 cells (.0%) have expected count less than 5. The minimum expected count is 199.62.b. Computed only for a 2x2 table | |||||
| Demographic Variable | Number of Cases | Number of Valid Cases | Yes | No | |
|---|---|---|---|---|---|
| Age (18-25) | 1290 (100%) | 27 | 15 | 12 | |
| Age (26-30) | 129 | 73 | 56 | ||
| Age (31-35) | 244 | 133 | 111 | ||
| Age (36-40) | 214 | 114 | 100 | ||
| Age (41-45) | 235 | 106 | 129 | ||
| Age (46-59) | 236 | 123 | 113 | ||
| Over 60 | 24 | 8 | 16 | ||
| Total | 1109 (86%) | 572 | 537 | ||
| Chi-Square Tests | Value | df | Asymptotic significance | ||
| Pearsons Chi Square | 9.720a | 6 | .137 | ||
| Likelihood Ratio | 9.776 | 6 | .134 | ||
| Linear-by-linear Association | 4.080 | 1 | .043 | ||
| No. of Valid Cases | 1109 | ||||
| a. 0 cells (.0%) have expected count less than 5. The minimum expected count is 11.62. | |||||
| Demographic Variable | Number of Cases | Number of Valid Cases | Yes | No | |
| Emirati | 1290 (100%) | 458 | 230 | 228 | |
| Non-Emirati | 653 | 344 | 309 | ||
| Total | 1111 (86.1%) | 574 | 537 | ||
| Chi-Square Tests | Value | df | Asymptotic significance | Exact Sig. (2-sided) | Exact Sig. (1-sided) |
| Pearsons Chi Square | .653a | 1 | .419 | ||
| Likelihood Ratio | .558 | 1 | .455 | ||
| Fishers Exact Test | .653 | 1 | .419 | ||
| Linear-by-linear Association | .428 | .227 | |||
| No. of Valid Cases | .653 | 1 | .419 | ||
| a. 0 cells (.0%) have expected count less than 5. The minimum expected count is 221.37.b. Computed only for a 2x2 table | |||||
Figure 2.Percent of Effect for Change in SSB Consumption During Covid-19 Lockdown for 'Yes' Responders.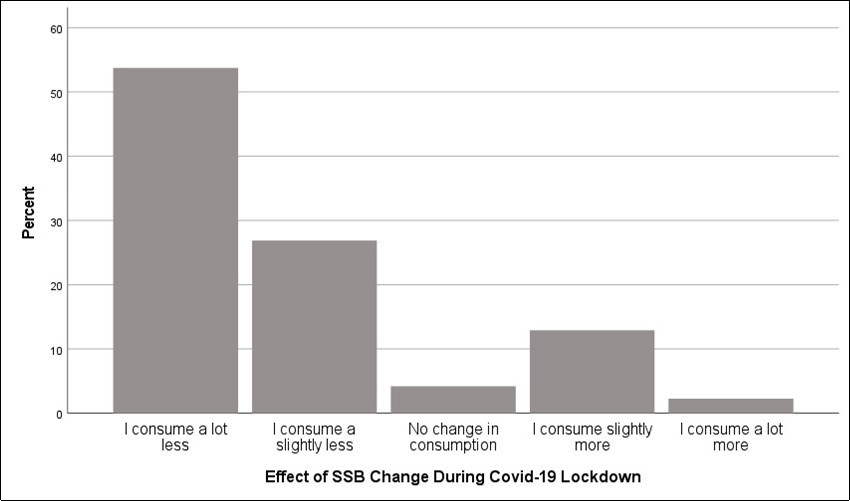
Discussion
Our study provides new insight on the association between key demographic factors (gender, age, and nationality) and SSB consumption in the UAE. The data analysis suggests that changes in SSB consumption were not statistically significant since the introduction of the SSB tax. The percentage of sugar consumed per day from SSB indicates a statistical significance by nationality (P-value <0.001). Several factors may explain this finding. Approximately 88.53% of the UAE population are non-Emirati derived from over 200 nationalities, and tourism has been steadily rising; for example, Dubai was ranked sixth globally on the tourism index with 16.73 million visitors in 2019 and with this, an increasing need to cater for a variety of dietary needs. 38, 39 Studies have also highlighted higher consumption patterns among high-income countries compared to low-income countries. 40 High-income countries generally consume more sugary drinks due to greater SSB availability, a higher proportion of disposable income and purchasing power. 40 Also, the prevalence of obesity is known to be high among expats. 41
Some studies have explored the impact of taxation on SSB. Colchero et al. estimated changes in sugar-sweetened beverages (SSB) sales and plain water after a 1 peso per litre excise SSB tax were implemented in Mexico in January 2014. 42 The authors report a 7.3% decrease in SSB sales and a 5.2% increase in water sales but highlighted that change should be evaluated over the longer term. Sliver et al. examined the association of the first penny per ounce SSB excise tax in the United States, in Berkeley, California, with beverage prices, sales, store revenue/consumer spending, and usual beverage intake. 43 The authors report a price increase (but not across all settings), sales declined, and sales in untaxed products (especially water) rose. There was no overall spend per transaction and no significant self-reported SSB change from baseline. The findings from these two studies (Colchero et al. and Sliver et al.) and our findings suggest that SSB tax may promote healthier behaviours, but change may not be statistically significant or long term. The reasons for this might extend to the substitution effect, promotional offers, introduction of new products into the market or effect of technologies such as the growth of mobile platforms. Thus, decision-makers may need to account for market responses during policymaking because these responses may hinder the desired change or dilute the intended impact of policy. We found no significant change in SSB consumption following the implementation of SSB tax and therefore accept our Null Hypothesis.
The study explored SSB consumption during Covid-19 lockdown. The number of respondents who reported consuming less SSB during the Covid-19 lockdown was slightly higher than those that reported no change (574 vs 537, respectively). It is plausible that the lockdown may have restricted the temptation for SSB, led to the prioritisation of beverages, or created a false impression of price elasticity among respondents. While research on SSB during Covid-19 lockdown is limited, there is evidence to suggest restricting access and availability of SSB in school and the workplace may lead to substitution or reduction in consumption. 44, 45 We found no significant difference in SSB consumption during Covid-19 lockdown between the ‘yes’ and ‘no’ responses and therefore accept our Null Hypothesis. However, our findings from the group that reported ‘yes’ suggest a positive change within the group.
The study does not explore the nature of SSB taxation or its impact on obesity and health outcomes, however; the logical pathway remains relevant as a framework for understanding SSB taxation. There are challenges in implementing the framework due to a lack of consensus on the policy approach and a lack of standardised tools to quantify consumption. This means consumption may vary considerably among individuals or, indeed, population groups. Consumption may be inappropriately estimated due to insufficient knowledge or recall bias, and respondents may find it difficult to quantify their sugar consumption between food and drink. Thus the need to develop validated research tools to quantify consumption more accurately. This would provide greater insight on the effects of SSB tax within population groups and at scale. Additionally, such tools would make it possible to conduct comparative analysis across different regulatory jurisdictions and maximise opportunities to determine superior SSB policy directives.
Limitations
The study has limitations. We may have excluded specific groups within the population through our sampling approach, such as disease-specific groups or groups with limited access to the internet. Despite achieving the minimum study sample for our population, the study would benefit from a higher response rate for greater generalisability. They may have been alternative explanations to our results due to several factors that were not accounted for, such as self-reporting and interpretation of questions and responder ability to segregate sugar consumption between ' food and drink. Also, adopting a quantitative approach to measure SSB consumption may limit our understanding of the findings' underlying issues.
Policy Implications
There are several policy implications from the study. Demographic factors should be considered when developing fiscal policy for SSB and different fiscal policy approaches should be considered. For example, imposing a levy on frequently consumed SSB or revisiting levy by the gram, volume, or type of added sugar or in combination may prove to be more effective in reducing SSB consumption. Performance measures should be considered at different policy implementation stages to determine the impact and provide the opportunity to mitigate the unintended consequences.
Conclusions
Change in SSB consumption by gender, age or nationality was not statistically significant since the introduction of SSB tax, or during Covid-19 lock-down; thus, we accept the Null Hypothesis. Imposing a levy on frequently consumed SSB or revisiting levy by the gram, volume, or type of added sugar (or in combination) may prove to be more effective in reducing SSB consumption. Further research is needed to determine the extent other demographic factors influence SSB consumption as well as the enablers and barriers associated with SSB consumption.
Ethical Approval
Ethical approval for the study and survey was granted from the Mohammed Bin Rashid School of Government Ethics Committee (REC-80-2020).
Acknowledgement
The authors would like to acknowledge Mohammed Bin Rashid School of Government, Dubai, UAE, and the Alliance for Health Policy and Systems Research at the World Health Organization for financial support as part of the Knowledge to Policy (K2P) Center Mentorship Program (BIRD Project).
Supporting Information
References
- 1.Xu S, Xue Y. (2016) Pediatric Obesity: causes, symptoms, prevention and treatment. doi:. 10.3892/etm.2015.2853. Exp Ther Med. 11: 15-20.
- 2.Garaulet M, Ordovás J M, Madrid J A. (2010) The chronobiology, etiology and pathophysiology of obesity. doi:. , 10.1038/ijo.2010.118 Int J Obes 34, 1667-1683.
- 3.Zhang Cuilin, Kathryn M Rexrode, Dam Rob M van, Tricia Y Li, Frank B Hu. (2008) . Abdominal Obesity and the Risk of All-Cause, Cardiovascular, and Cancer Mortality. Sixteen Years of Follow-Up in U.S. Women. https://doi.org/10.1161/circulationaha.107.739714. Circulation. 117: 1658-1667.
- 4.Bacha F, Gidding S S. (2016) Cardiac abnormalities in youth with obesity and Type 2 Diabetes. Curr Diab Rep.doi: 10.1007/s11892-016-0750-6. 16: 62.
- 5.Sahoo K, Sahoo B, A K Choudhury, N Y Sofi, Kumar R et al. (2015) Childhood obesity: causes and consequences. https://doi.org/10.4103/2249-4863.154628 Journal of family medicine and primary care. 4(2), 187-192.
- 6.M L Specchia, M A Veneziano, Cadeddu C, A M Ferriero, Mancuso A et al. (2015) Economic impact of adult obesity on health systems: a systematic review. https://doi.org/10.1093/eurpub/cku170 European journal of public health. 25(2), 255-262.
- 7.Tremmel M, Gerdtham U G, Nilsson P M, Saha S. (2017) A Systematic Literature Review. https://doi.org/10.3390/ijerph14040435 International journal of environmental research and public health. , Economic Burden of Obesity 14(4), 435.
- 8.Ministry of Health, Prevention. (2019) . National Health Survey Results Officially Announced [Online]. .
- 10.V S Malik, Li Y, Pan A, L De Koning, Schernhammer E et al. (2019) . Long-Term Consumption of Sugar-Sweetened and Artificially Sweetened Beverages and Risk of Mortality in U.S. Adults. https://doi.org/10.1161/circulationaha.118.037401. Circulation 139(18), 2113-2125.
- 11.O T Mytton, Clarke D, Rayner M. (2012) Taxing unhealthy food and drinks to improve health. https://doi.org/10.1136/bmj.e2931BMJ (Clinical research ed.). 344 2931.
- 12.UAE Federal. (2020) . Excise Tax [Online]. https://u.ae/en/information-and-services/finance-and-investment/taxation/excise-tax Accessed [28 October, 2020]
- 14.Scutchfield, Keck. (2009) Principles of Public Health Practice. Cengage Learning; 3rd edition. February 9, 2009.
- 15.Jennifer Pomeranz. University of Michigan Journal of Law Reform. Yale University (2013) Taxing Food and Beverage Products: A Public Health Perspective and a New Strategy for Prevention. 46(3).
- 16. (2019) Organisation for Economic Co-operation and Development. The Heavy Burden of Obesity. Sabine Vuik and Michele Cecchini in Chapter 8. The impact of obesity policies on the food and drink industry.
- 18.M L Laitala, M, J I Virtanen. (2018) Frequent consumption of sugar-sweetened beverages and sweets starts at early age. https://doi.org/10.1080/00016357.2017.1387929. Acta odontologica Scandinavica 76(2), 105-110.
- 19.F Douglas Scutchfield, Keck William. (2009) Principles of Public Health Practice. Cengage Learning; 3rd edition.
- 20.K J Newens, Walton J. (2016) A review of sugar consumption from nationally representative dietary surveys across the world. https://doi.org/10.1111/jhn.12338 Journal of human nutrition and dietetics: the official journal of the British Dietetic Association. 29(2), 225-240.
- 21.M A Bruce, B M, R J Thorpe, Mincey K, D M Griffith. (2017) Racial and gender disparities in sugar consumption change efficacy among first-year college students. , https://doi.org/10.1016/j.appet.2016.11.017. Appetite 109, 33-39.
- 22.D E Chiriboga, Ma Y, Li W, B C Olendzki, S L Pagoto et al. (2008) Gender differences in predictors of body weight and body weight change in healthy adults. https://doi.org/10.1038/oby.2007.38. Obesity (Silver Spring. , Md 16(1), 137-145.
- 23. (2020) United States Department of Agriculture and Department of Health and Human Services. Dietary Guidelines for Americans. Eight Edition [Online]. https://health.gov/our-work/food-nutrition/previous-dietary-guidelines/2015 Accessed [29 December, 2020].
- 24.Kate Kelly, Clark Belinda, Brown Vivienne, Sitzial John. (2003) Good practice in the conduct and reporting of survey research.https://doi.org/10.1093/intqhc/mzg031 International Journal for Quality in Health Care.; Volume 15, Issue 3. 261-266.
- 25.Thomas L Jones, Mark A Baxter, Khanduja Vikas. (2013) A quick guide to survey research. Doi 10.1308/003588413X13511609956372. , Ann R Coll Surg Engl 95, 5-7.
- 26.Denscombe M. (1998) The Good Research Guide: For Small-scale Social Research Projects. Buckingham: Open University Press.
- 27.Rivard C, Smith D, S E McCann, Hyland A. (2012) Taxing sugar-sweetened beverages: a survey of knowledge, attitudes and behaviours. https://doi.org/10.1017/S1368980011002898. Public health nutrition 15(8), 1355-1361.
- 28.Miller C, Ettridge K, Wakefield M, Pettigrew S, Coveney J. (2020) Consumption of Sugar-Sweetened Beverages, Juice, Artificially-Sweetened Soda and Bottled Water: An Australian Population Study. https://doi.org/10.3390/nu12030817 Nutrients 2020; 12(3). 817.
- 29.Miller C L, Dono J, Wakefield M A, J S Coveney, Roder D. (2019) Are Australians ready for warning labels, marketing bans and sugary drink taxes? Two cross-sectional surveys measuring support for policy responses to sugar-sweetened beverages. , Doi: 10.1136/bmjopen-2018-027962. BMJ Open 9(6), 027962.
- 30.Cullerton K, Donnet T, Lee A, Gallegos D. (2016) Playing the policy game: a review of the barriers to and enablers of nutrition policy change. https://doi.org/10.1017/S1368980016000677. Public health nutrition 19(14), 2643-2653.
- 31.Krejcie R V, Morgan D W. (1970) Determining Sample Size for Research Activities. Doi:. 10.1177/001316447003000308 Educational and Psychological Measurement 30(3), 607-610.
- 32.Wilson V. (2014) Research Methods: Sampling. https://doaj.org/toc/1715-720X/9/2 Evidence-Based Library and Information Practice. 9(2), 45-47.
- 33.B A, G B Morgan, J A Schoeneberger, J D Kromrey, J M Ferron. (2014) How low can you go? An investigation of the influence of sample size and model complexity on point and interval estimates in two-level linear models. https://doi.org/10.1027/1614-2241/a000062. Methodology: European Journal of Research Methods for the Behavioral and Social Sciences. 10(1), 1-11.
- 34.Raosoft. (2020) Sample Size Calculator [Online]. http://www.raosoft.com/ Accessed [30 December, 2020].
- 35.Cummings P, F P Rivara. (2003) Reporting statistical information in medical journals. , Arch Pediatr Adolesc Med 157(4), 321-324.
- 36.Niroumanda Hamed, Zain M, Jamil Maslina. (2013) . Statistical Methods for Comparison of Data Sets of Construction Methods and Building Evaluation. Procedia - Social and Behavioral Sciences 89, 218-221.
- 37.Global Media Insight. (2021) United Arab Emirates Population Statistics [Online]. https://www.globalmediainsight.com/blog/uae-population-statistics/ Accessed [03 January, 2021].
- 38.Dubai Tourism. (2021) Annual Visitor Report [Online]. Available from: https://www.dubaitourism.gov.ae/en/research-and-insights. , Accessed [05 January, 2021]
- 39.Sharara E, Akik C, Ghattas H, Obermeyer Makhlouf, C. (2018) Physical inactivity, gender and culture in Arab countries: a systematic assessment of the literature. https://doi.org/10.1186/s12889-018-5472-z. BMC public health. 18(1), 639.
- 40.Singh G M, Micha R, Khatibzadeh S, Shi P, Lim S. (2019) . Correction: Global, Regional, and National Consumption of Sugar-Sweetened Beverages, Fruit Juices, and Milk: A Systematic Assessment of Beverage Intake in 187 Countries. https://doi.org/10.1371/journal.pone.0214344. PLOS ONE 14(3), 0214344.
- 41.Sulaiman Nabil.Salah Elbadawi, Amal Hussein, Salah Abusnana, Abdulrazzag Madani, et al (2017) Prevalence of overweight and obesity. in United Arab Emirates Expatriates: the UAE National Diabetes and Lifestyle Study. https://doi.org/10.1186/s13098-017-0287-0. Diabetology & metabolic syndrome. 9 88.
- 42.Colchero M A, Guerrero-LoÂpez C M, Molina M, Rivera J A. (2016) . Beverages Sales in Mexico before and after Implementation of a Sugar-Sweetened Beverage Tax. doi: 10.1371/journal.pone.0163463. PLoS ONE 11(9), 0163463.
- 43.Silver L D, Ng S W, Ryan-Ibarra S, Taillie L S, Induni M. (2017) Changes in prices, sales, consumer spending, and beverage consumption one year after a tax on sugar-sweetened beverages in Berkeley, California, U.S. A before-and-after study. PLoS Med. https://doi.org/10.1371/journal.pmed.1002283 . 14(4), 1002283.
- 44.D R Taber, J F Chriqui, L M Powell, F J Chaloupka. (2012) Banning all sugar-sweetened beverages in middle schools: reduction of in-school access and purchasing but not overall consumption. https://doi.org/10.1001/archpediatrics.2011.200. Archives of pediatrics & adolescent medicine 166(3), 256-262.
Cited by (1)
This article has been cited by 1 scholarly work according to:
Citing Articles:
A. Al-Jawaldeh, A. Perucic, A. Hammerich, Adham Rashad Ismail Abdel Moneim, Eman T Ibrahim et al. - Eastern Mediterranean health journal = La revue de sante de la Mediterranee orientale = al-Majallah al-sihhiyah li-sharq al-mutawassit (2024) Semantic Scholar